
Average household size by ZIP code
An interactive U.S. map of average household size for states, metro areas, counties, ZIP codes, census tracts and census block groups. Latest data: 2020–24. PLUS
Open average household size on the map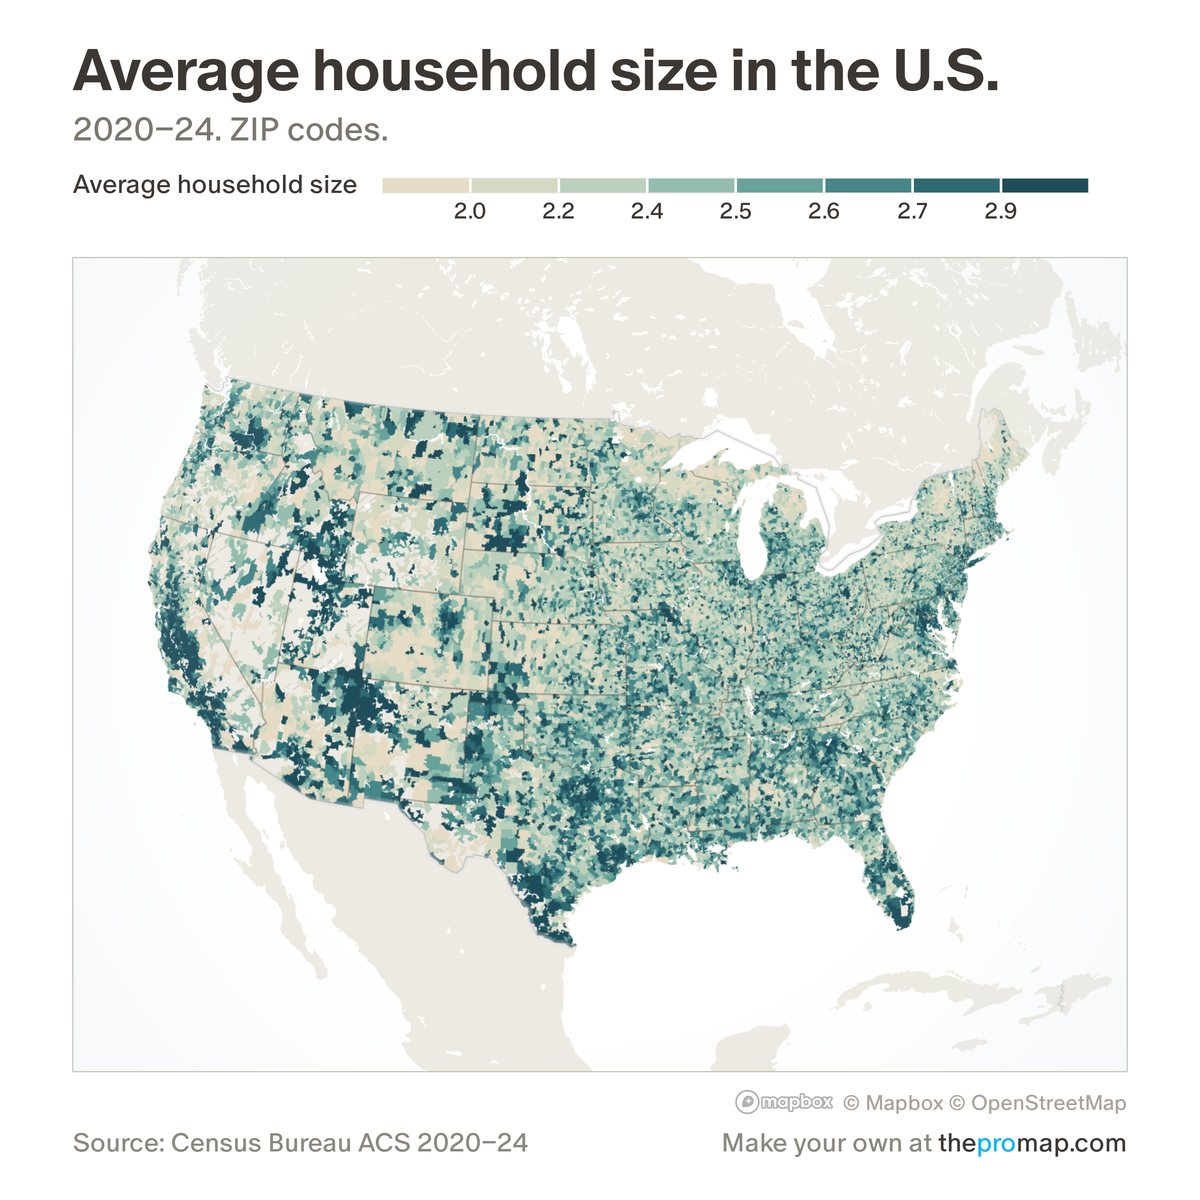
What this measure is
The average number of people living in each occupied home. People in group quarters such as dormitories, prisons and nursing homes are not in households. It is a Census Bureau survey estimate pooled over five years; in census tracts and block groups, white stripes over the colour mark low reliability: a wide margin of error.
Source, dates and coverage
- Source
- Census Bureau American Community Survey.
- Updated
- Once a year, when the Census Bureau releases a new five-year survey. Latest data on the map: 2020–24.
- Areas on the map
- States, metro areas, counties, ZIP codes, census tracts and census block groups.
- Group
- Demographics
- Access
- ProMap Plus ($19 a month or $190 a year).
Values for every place
Average household size is a ProMap Plus measure. The map shows it for the areas listed above. This page shows the map's national picture, the method and the source, and no figures.
ProMap Plus costs $19 a month or $190 a year. A free 7-day trial is offered on the map.
See average household size in ProMap PlusHow to cite
Please also credit the original source: Census Bureau American Community Survey.