
Fanciness index by ZIP code
An interactive U.S. map of fanciness index for states, metro areas, counties and ZIP codes. Latest data: May 2026. PLUS
Open fanciness index on the map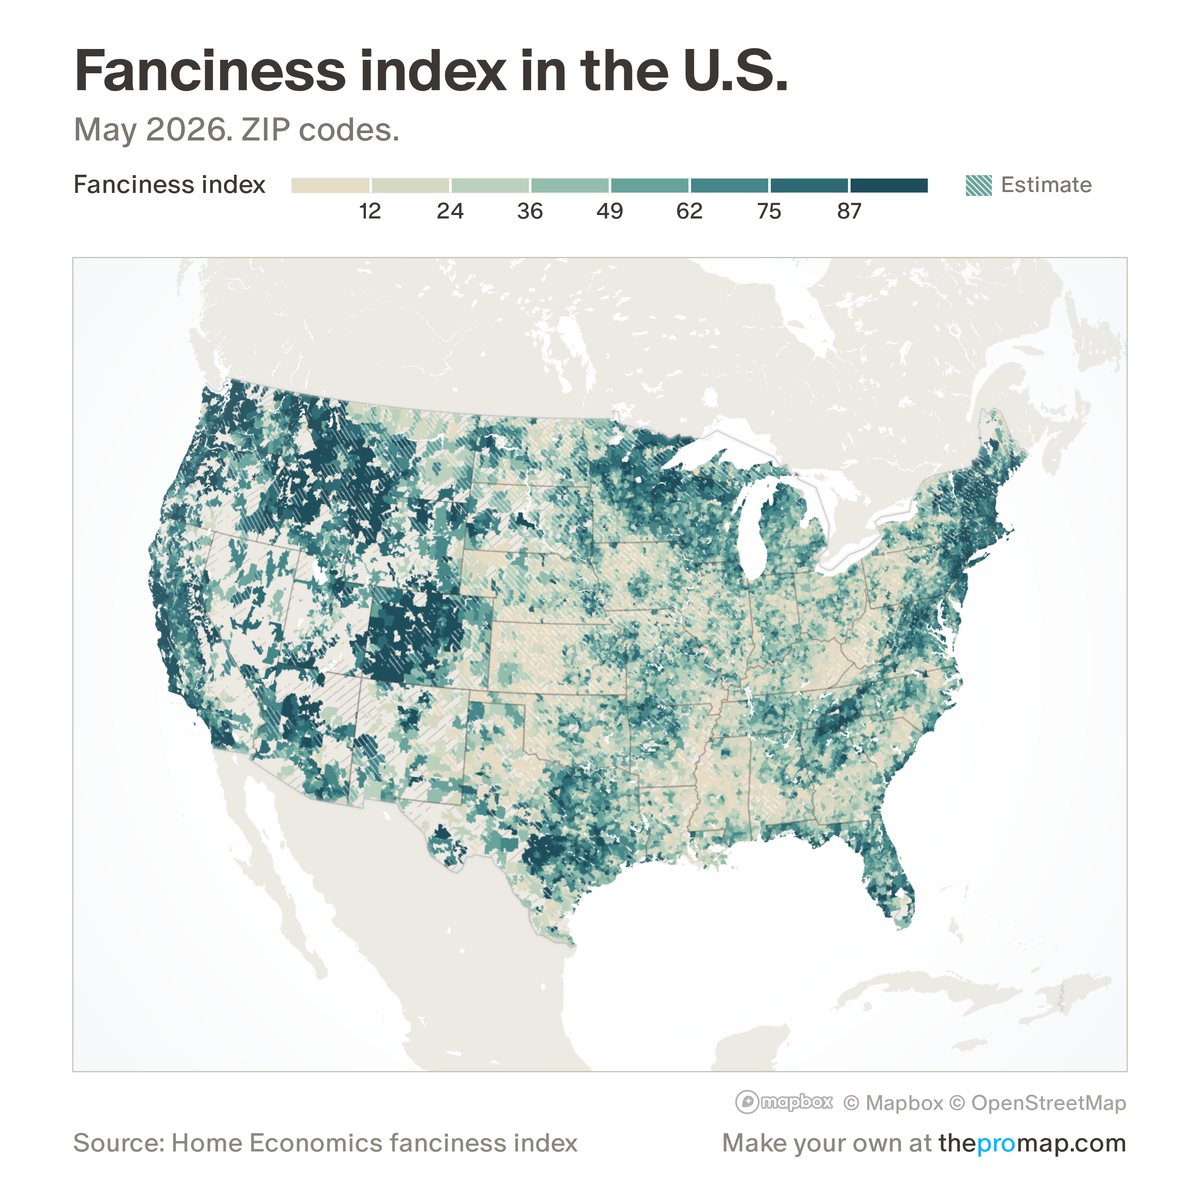
What this measure is
How upscale a ZIP code looks, as a national percentile: 100 is the fanciest ZIP in the country and 50 is the middle. A model predicts the price per square foot a place would have, given its stores, incomes, health, housing and political donations and allowing for population density, and ZIPs are ranked on that prediction. The model is trained on other states, so a ZIP is never scored using its own state's prices. Counties, metros and states show the typical resident's ZIP: a population-weighted average.
Source, dates and coverage
- Source
- Home Economics model using Redfin prices and Census, IRS, CDC, Overture Maps and FEC data.
- Updated
- Rebuilt once a year. This version uses prices to May 2026. Latest data on the map: May 2026.
- Areas on the map
- States, metro areas, counties and ZIP codes.
- Group
- Neighborhood character
- Access
- ProMap Plus ($19 a month or $190 a year).
Values for every place
Fanciness index is a ProMap Plus measure. The map shows it for the areas listed above. This page shows the map's national picture, the method and the source, and no figures.
ProMap Plus costs $19 a month or $190 a year. A free 7-day trial is offered on the map.
See fanciness index in ProMap PlusHow to cite
Please also credit the original source: Home Economics model using Redfin prices and Census, IRS, CDC, Overture Maps and FEC data.