
Mortgages 90+ days late by county
An interactive U.S. map of mortgages 90+ days late for states, metro areas and counties. Latest data: March 2026. PLUS
Open mortgages 90+ days late on the map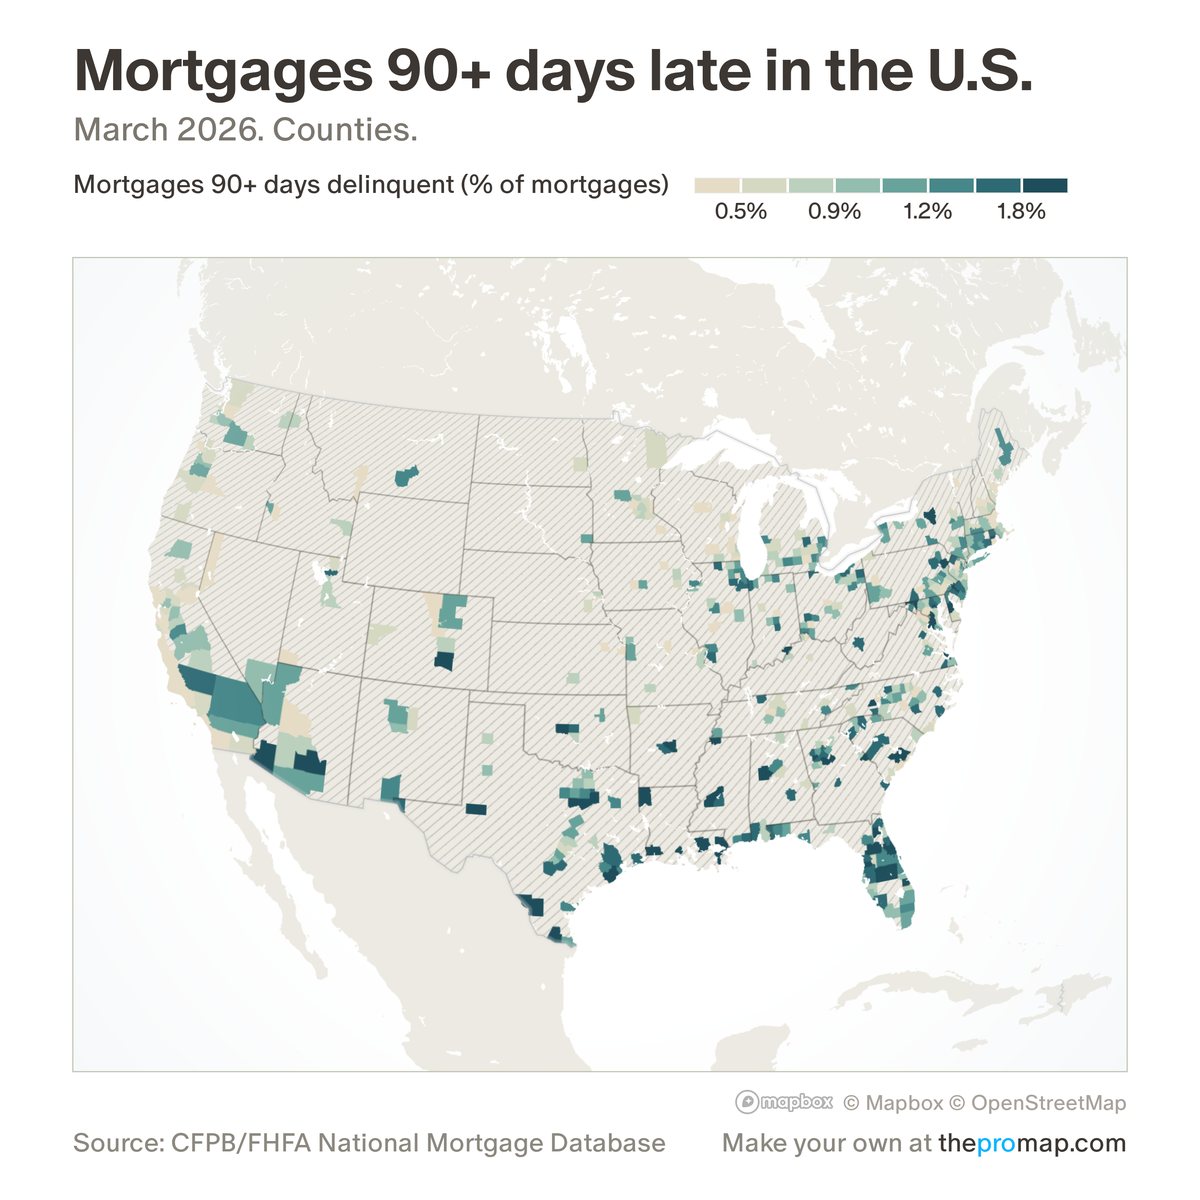
What this measure is
The share of outstanding first mortgages on homes with one to four units that are 90 or more days past due but not in foreclosure. It comes from the National Mortgage Database, a 5% sample of US mortgages run by two federal agencies. They publish every state, 311 metro areas and about 500 counties with enough sample loans; other areas are hatched. Earlier months are revised, and late payments read low in 2020–21, when many borrowers were in forbearance.
Source, dates and coverage
- Source
- Consumer Financial Protection Bureau and Federal Housing Finance Agency, National Mortgage Database.
- Updated
- Monthly, several months after the month shown. Latest data on the map: March 2026.
- Areas on the map
- States, metro areas and counties.
- Group
- Mortgage delinquency
- Access
- ProMap Plus ($19 a month or $190 a year).
Values for every place
Mortgages 90+ days late is a ProMap Plus measure. The map shows it for the areas listed above. This page shows the map's national picture, the method and the source, and no figures.
ProMap Plus costs $19 a month or $190 a year. A free 7-day trial is offered on the map.
See mortgages 90+ days late in ProMap PlusHow to cite
Please also credit the original source: Consumer Financial Protection Bureau and Federal Housing Finance Agency, National Mortgage Database.