
Net migration by county
An interactive U.S. map of net migration for states, metro areas and counties. Latest data: 2025. PLUS
Open net migration on the map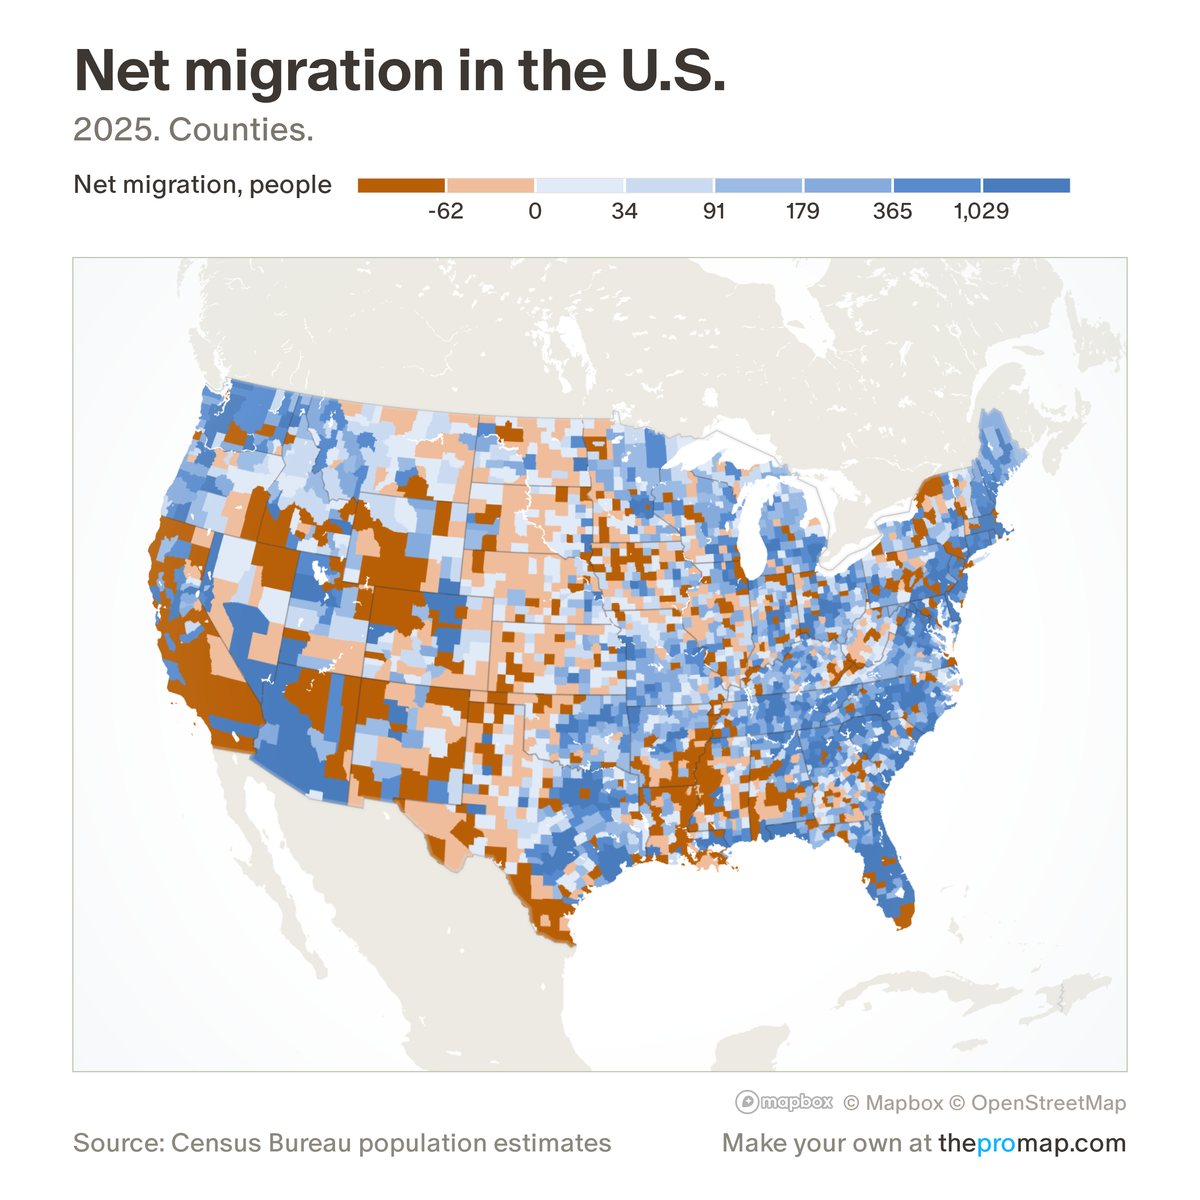
What this measure is
People who moved in minus people who moved out, from within the US and from abroad together. Home Economics works it out as population change minus births plus deaths, on one Census population series that agrees with both the 2010 and 2020 censuses, so years before and after 2020 compare without a break in method. It cannot split domestic from international moves. It is shown as a count or per 1,000 residents, for states, counties and metros.
Source, dates and coverage
- Source
- Home Economics calculation from Census Bureau population estimates.
- Updated
- Once a year. Latest data on the map: 2025.
- Areas on the map
- States, metro areas and counties.
- Group
- Components of change
- Access
- ProMap Plus ($19 a month or $190 a year).
Values for every place
Net migration is a ProMap Plus measure. The map shows it for the areas listed above. This page shows the map's national picture, the method and the source, and no figures.
ProMap Plus costs $19 a month or $190 a year. A free 7-day trial is offered on the map.
See net migration in ProMap PlusHow to cite
Please also credit the original source: Home Economics calculation from Census Bureau population estimates.