
Property-tax rate (effective) by ZIP code
An interactive U.S. map of property-tax rate (effective) for states, metro areas, counties, ZIP codes and census tracts. Latest data: 2020–24. PLUS
Open property-tax rate (effective) on the map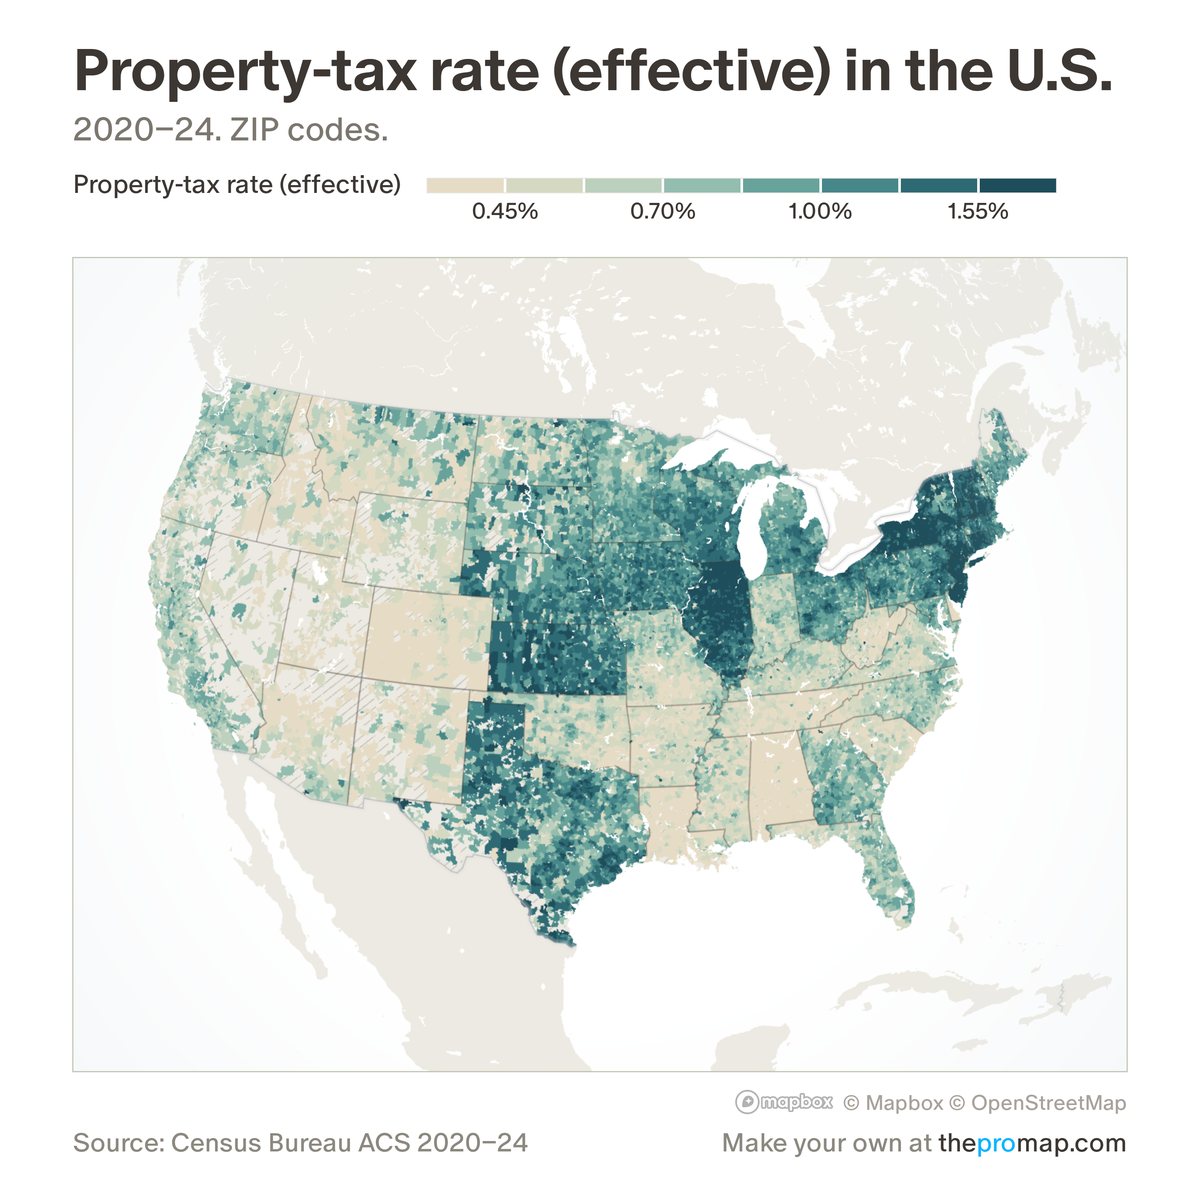
What this measure is
Property taxes paid each year as a share of home value, for owner-occupied homes: total taxes paid divided by the total value of the homes. Both figures are what owners report in the Census Bureau survey. Totals are used instead of medians because the Census caps the median tax bill at $10,000, which would understate the rate where typical bills are higher.
Source, dates and coverage
- Source
- Census Bureau American Community Survey, five-year estimates.
- Updated
- Once a year. Latest data on the map: 2020–24.
- Areas on the map
- States, metro areas, counties, ZIP codes and census tracts.
- Group
- Taxes
- Access
- ProMap Plus ($19 a month or $190 a year).
Values for every place
Property-tax rate (effective) is a ProMap Plus measure. The map shows it for the areas listed above. This page shows the map's national picture, the method and the source, and no figures.
ProMap Plus costs $19 a month or $190 a year. A free 7-day trial is offered on the map.
See property-tax rate (effective) in ProMap PlusHow to cite
Please also credit the original source: Census Bureau American Community Survey, five-year estimates.