
School test scores vs US average by ZIP code
An interactive U.S. map of school test scores vs US average for states, metro areas, counties, school districts, ZIP codes and individual schools. PLUS
Open school test scores vs US average on the map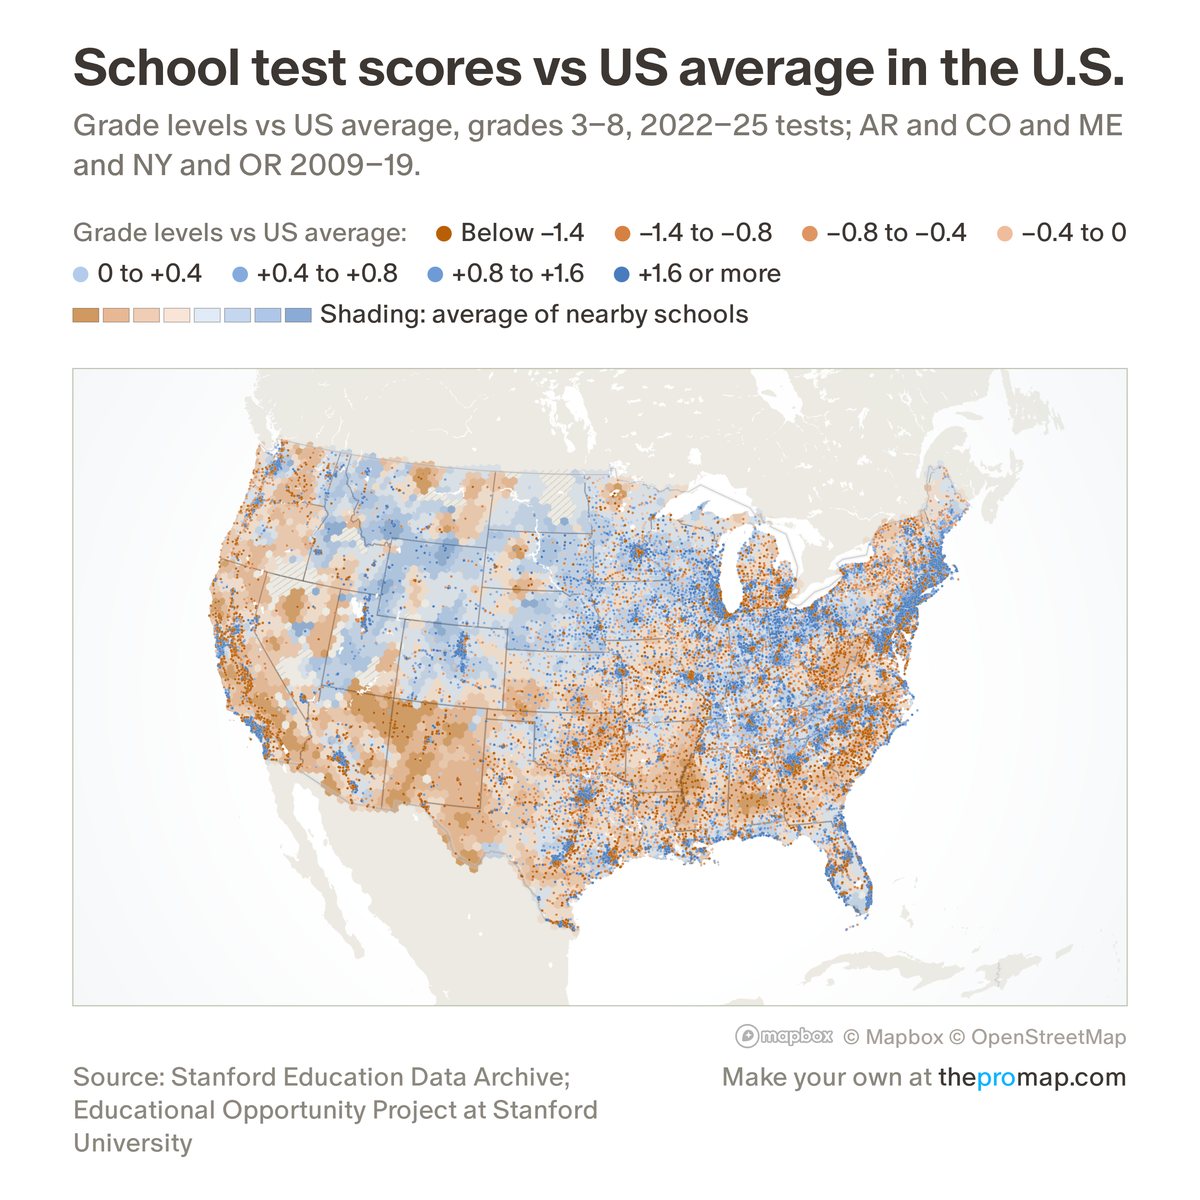
What this measure is
One dot for each public school, district or charter, with grade 3–8 math and reading results, coloured by its average score in grade levels above (+) or below (−) the US average, on the same colours as the School test scores layer. Each school is compared with the US average for the grades it tests, so elementary and middle schools compare fairly. Click or tap a dot for the school's card: its district, grades tested, learning growth, trend and number of tests. New York, Colorado, Oregon, Alaska, Arkansas and Maine have no comparable recent scores, so their schools show the 2009–19 average, drawn like the others; those six states are not directly comparable with the rest. Schools with fewer than 100 tests and high schools have no dot. Use Measure to switch to learning growth per school year (also one dot per school, for schools with a learning rate) or to the change in test scores since 2019 (school districts, ZIP codes, counties and hexagons only: the archive has no yearly figures for single schools). Use Shading to choose the average of nearby schools, attendance zones (New York City only so far, each zone in the colour of its zoned school) or areas.
Source, dates and coverage
- Source
- Stanford Education Data Archive (2025.2), Educational Opportunity Project at Stanford University.
- Updated
- From the archive's 2025.2 release, with scores to 2025.
- Areas on the map
- States, metro areas, counties, school districts, ZIP codes and individual schools.
- Group
- Schools
- Access
- ProMap Plus ($19 a month or $190 a year).
Values for every place
School test scores vs US average is a ProMap Plus measure. The map shows it for the areas listed above. This page shows the map's national picture, the method and the source, and no figures.
ProMap Plus costs $19 a month or $190 a year. A free 7-day trial is offered on the map.
See school test scores vs US average in ProMap PlusHow to cite
Please also credit the original source: Stanford Education Data Archive (2025.2), Educational Opportunity Project at Stanford University.