
Permits: single-family by county
An interactive U.S. map of permits: single-family for states, metro areas and counties. Latest data: 12 months to Sep 2026. PLUS
Open permits: single-family on the map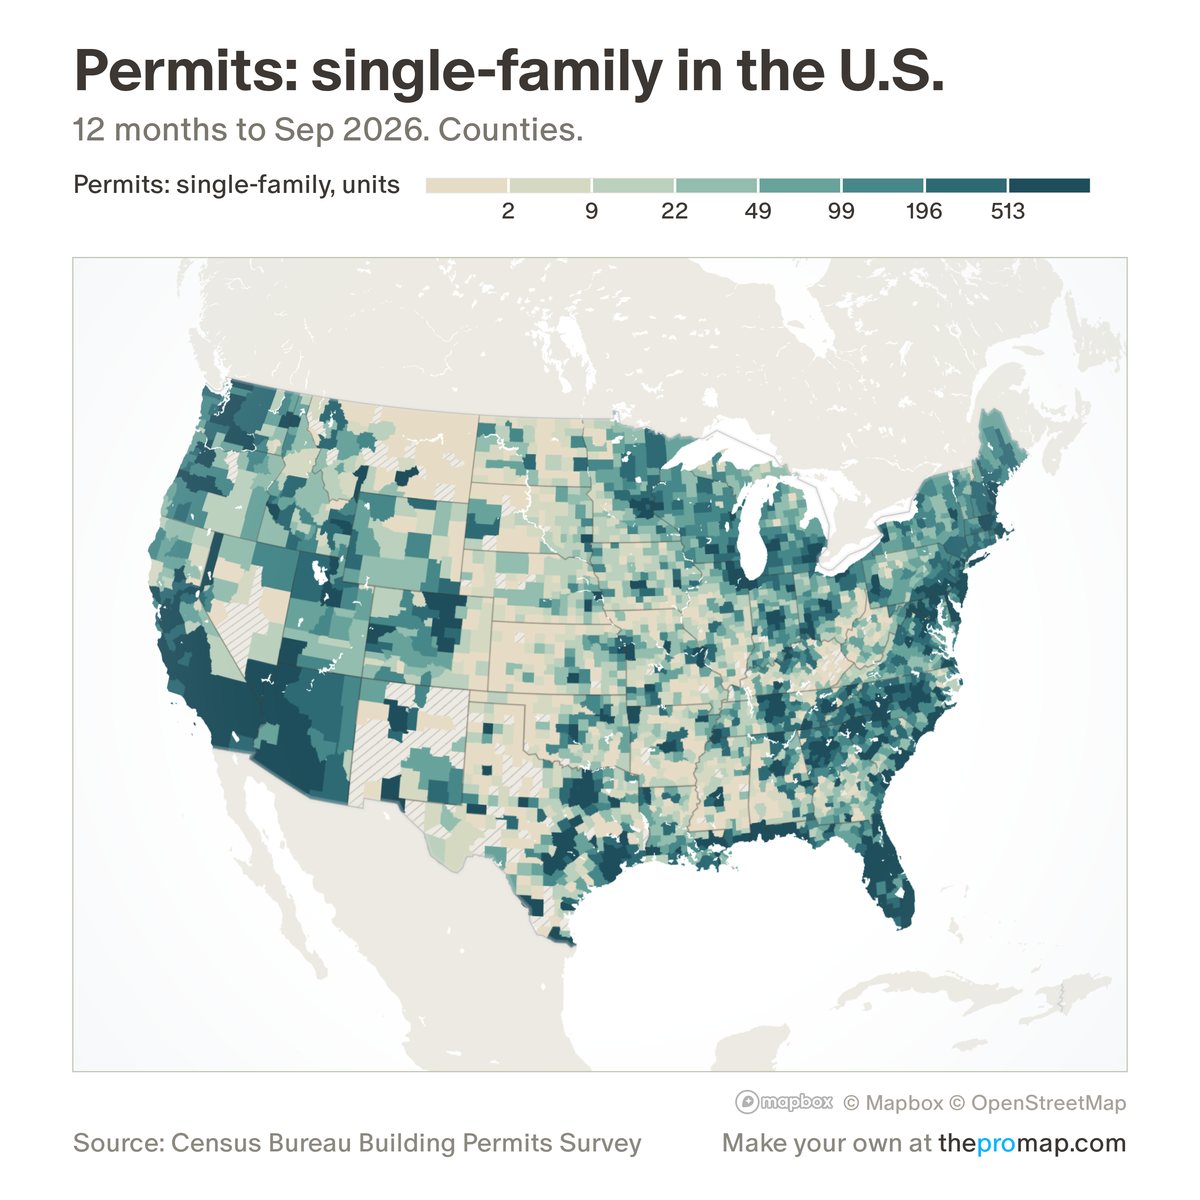
What this measure is
New privately owned single-family homes authorised by building permits over the last 12 months, per 1,000 residents by default or as a count. Permits are approvals, not homes started or finished, and some permit offices report only once a year, so the Census Bureau estimates their months. The survey has no ZIP code figures; metros add up their counties.
Source, dates and coverage
- Source
- Census Bureau Building Permits Survey; residents: Census Bureau population estimates.
- Updated
- Monthly. Latest data on the map: 12 months to Sep 2026.
- Areas on the map
- States, metro areas and counties.
- Group
- Housing supply
- Access
- ProMap Plus ($19 a month or $190 a year).
Values for every place
Permits: single-family is a ProMap Plus measure. The map shows it for the areas listed above. This page shows the map's national picture, the method and the source, and no figures.
ProMap Plus costs $19 a month or $190 a year. A free 7-day trial is offered on the map.
See permits: single-family in ProMap PlusHow to cite
Please also credit the original source: Census Bureau Building Permits Survey; residents: Census Bureau population estimates.