
Commute by transit by ZIP code
An interactive U.S. map of commute by transit for states, metro areas, counties, ZIP codes, census tracts and census block groups. Latest data: 2020–24. PLUS
Open commute by transit on the map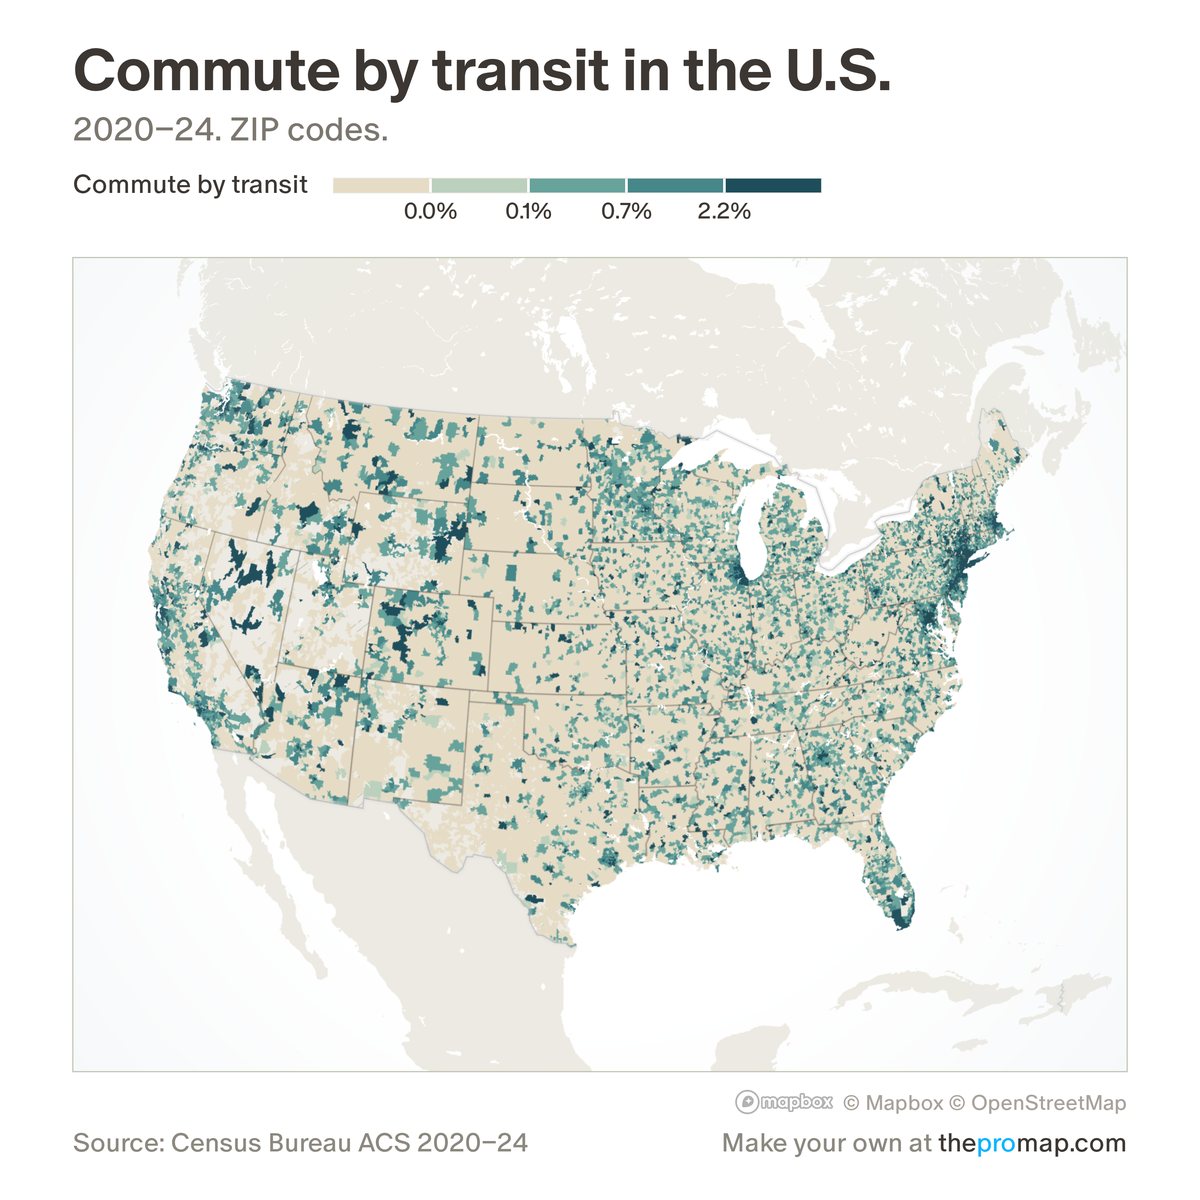
What this measure is
The share of workers aged 16 and over who usually get to work by public transport, such as bus, subway or train; taxis are not counted. Workers who work from home are in the total. It is a Census Bureau survey estimate pooled over five years; in census tracts and block groups, white stripes over the colour mark low reliability: a wide margin of error.
Source, dates and coverage
- Source
- Census Bureau American Community Survey.
- Updated
- Once a year, when the Census Bureau releases a new five-year survey. Latest data on the map: 2020–24.
- Areas on the map
- States, metro areas, counties, ZIP codes, census tracts and census block groups.
- Group
- Housing stock & commute
- Access
- ProMap Plus ($19 a month or $190 a year).
Values for every place
Commute by transit is a ProMap Plus measure. The map shows it for the areas listed above. This page shows the map's national picture, the method and the source, and no figures.
ProMap Plus costs $19 a month or $190 a year. A free 7-day trial is offered on the map.
See commute by transit in ProMap PlusHow to cite
Please also credit the original source: Census Bureau American Community Survey.