
Job growth, past year by county
An interactive U.S. map of job growth, past year for states, metro areas and counties. Latest data: 2026. PLUS
Open job growth, past year on the map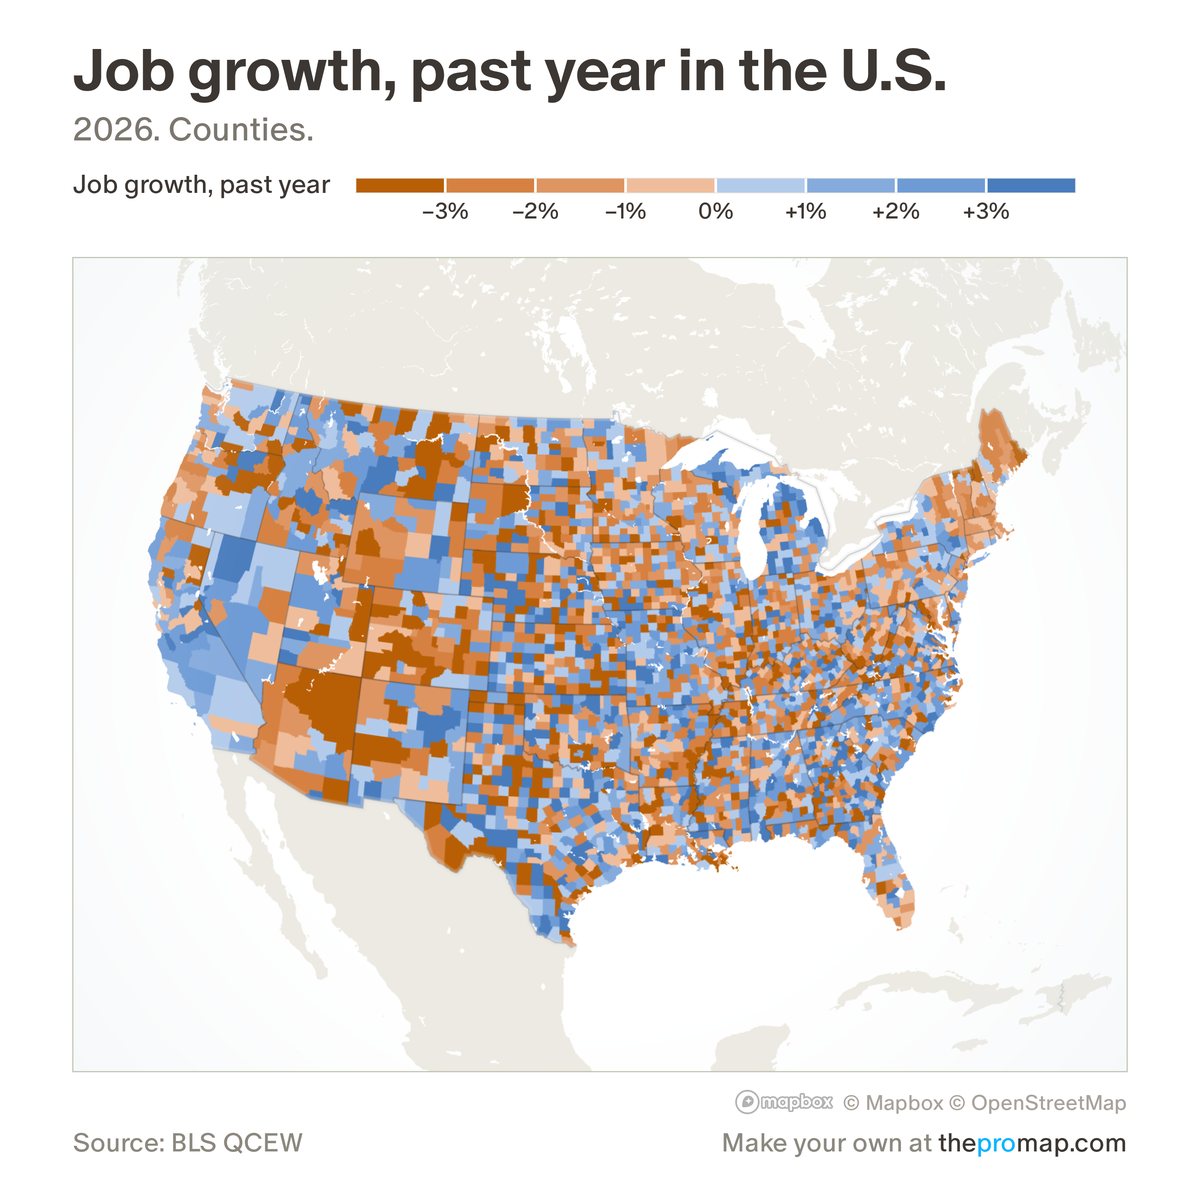
What this measure is
The change in the number of jobs over the past year: the latest quarter against the same quarter a year earlier, all industries. It comes from a near-complete count of jobs from employers' unemployment-insurance tax filings, which covers about 95% of jobs but not most self-employed people. Jobs are counted where people work, not where they live, and the latest quarter is preliminary.
Source, dates and coverage
- Source
- Bureau of Labor Statistics, Quarterly Census of Employment and Wages.
- Updated
- Every quarter, about five to six months after the quarter ends. Latest data on the map: 2026.
- Areas on the map
- States, metro areas and counties.
- Group
- Jobs & unemployment
- Access
- ProMap Plus ($19 a month or $190 a year).
Values for every place
Job growth, past year is a ProMap Plus measure. The map shows it for the areas listed above. This page shows the map's national picture, the method and the source, and no figures.
ProMap Plus costs $19 a month or $190 a year. A free 7-day trial is offered on the map.
See job growth, past year in ProMap PlusHow to cite
Please also credit the original source: Bureau of Labor Statistics, Quarterly Census of Employment and Wages.