
Unemployment rate by county
An interactive U.S. map of unemployment rate for states, metro areas and counties. Latest data: 2026. PLUS
Open unemployment rate on the map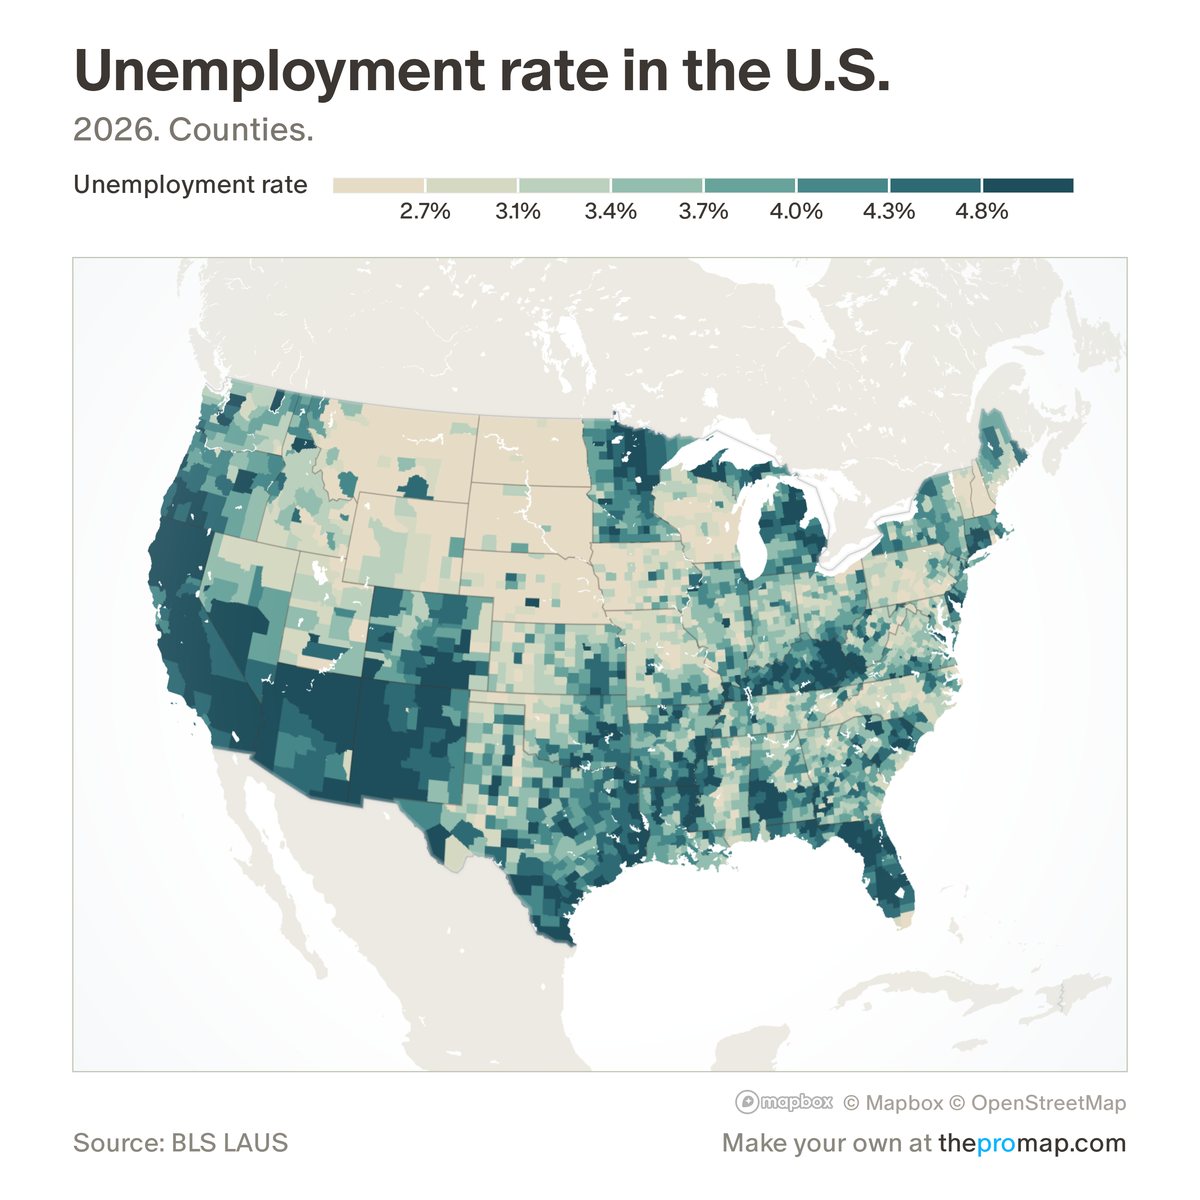
What this measure is
The share of the labour force, people working or looking for work, who are unemployed. The figures are not seasonally adjusted, because the Bureau of Labor Statistics publishes no adjusted county figures, so the rate moves with the seasons; the 1-year change compares the same month. The latest month is preliminary and is revised.
Source, dates and coverage
- Source
- Bureau of Labor Statistics, Local Area Unemployment Statistics.
- Updated
- Monthly. Latest data on the map: 2026.
- Areas on the map
- States, metro areas and counties.
- Group
- Jobs & unemployment
- Access
- ProMap Plus ($19 a month or $190 a year).
Values for every place
Unemployment rate is a ProMap Plus measure. The map shows it for the areas listed above. This page shows the map's national picture, the method and the source, and no figures.
ProMap Plus costs $19 a month or $190 a year. A free 7-day trial is offered on the map.
See unemployment rate in ProMap PlusHow to cite
Please also credit the original source: Bureau of Labor Statistics, Local Area Unemployment Statistics.