
Population density by ZIP code
An interactive U.S. map of population density for states, metro areas, counties, ZIP codes, census tracts and census block groups. Latest data: 2020–24. PLUS
Open population density on the map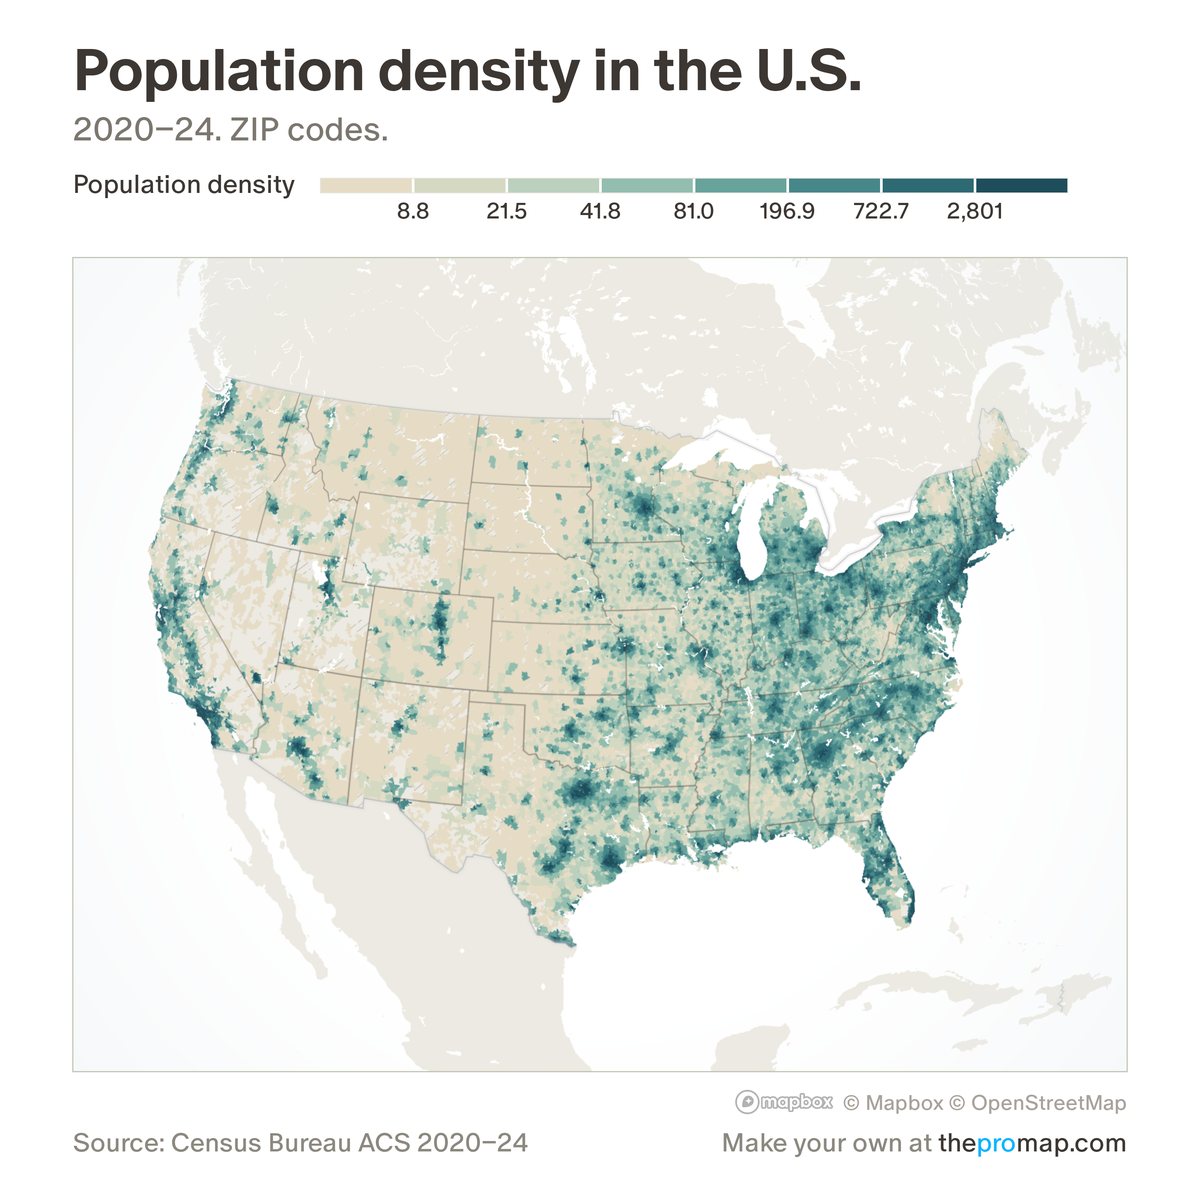
What this measure is
Residents per square mile of land; water is left out. States, counties and metros use the Census Bureau's July 1 estimates; ZIP codes and smaller areas use the five-year American Community Survey. Hatched areas have no figure: fewer than 100 residents.
Source, dates and coverage
- Source
- Census Bureau population estimates. Census Bureau American Community Survey; land area: Census Bureau boundary files.
- Updated
- Once a year. Latest data on the map: 2020–24.
- Areas on the map
- States, metro areas, counties, ZIP codes, census tracts and census block groups.
- Group
- Population
- Access
- ProMap Plus ($19 a month or $190 a year).
Values for every place
Population density is a ProMap Plus measure. The map shows it for the areas listed above. This page shows the map's national picture, the method and the source, and no figures.
ProMap Plus costs $19 a month or $190 a year. A free 7-day trial is offered on the map.
See population density in ProMap PlusHow to cite
Please also credit the original source: Census Bureau population estimates. Census Bureau American Community Survey; land area: Census Bureau boundary files.