
Population dots
An interactive U.S. map of population dots for census blocks (dots). PLUS
Open population dots on the map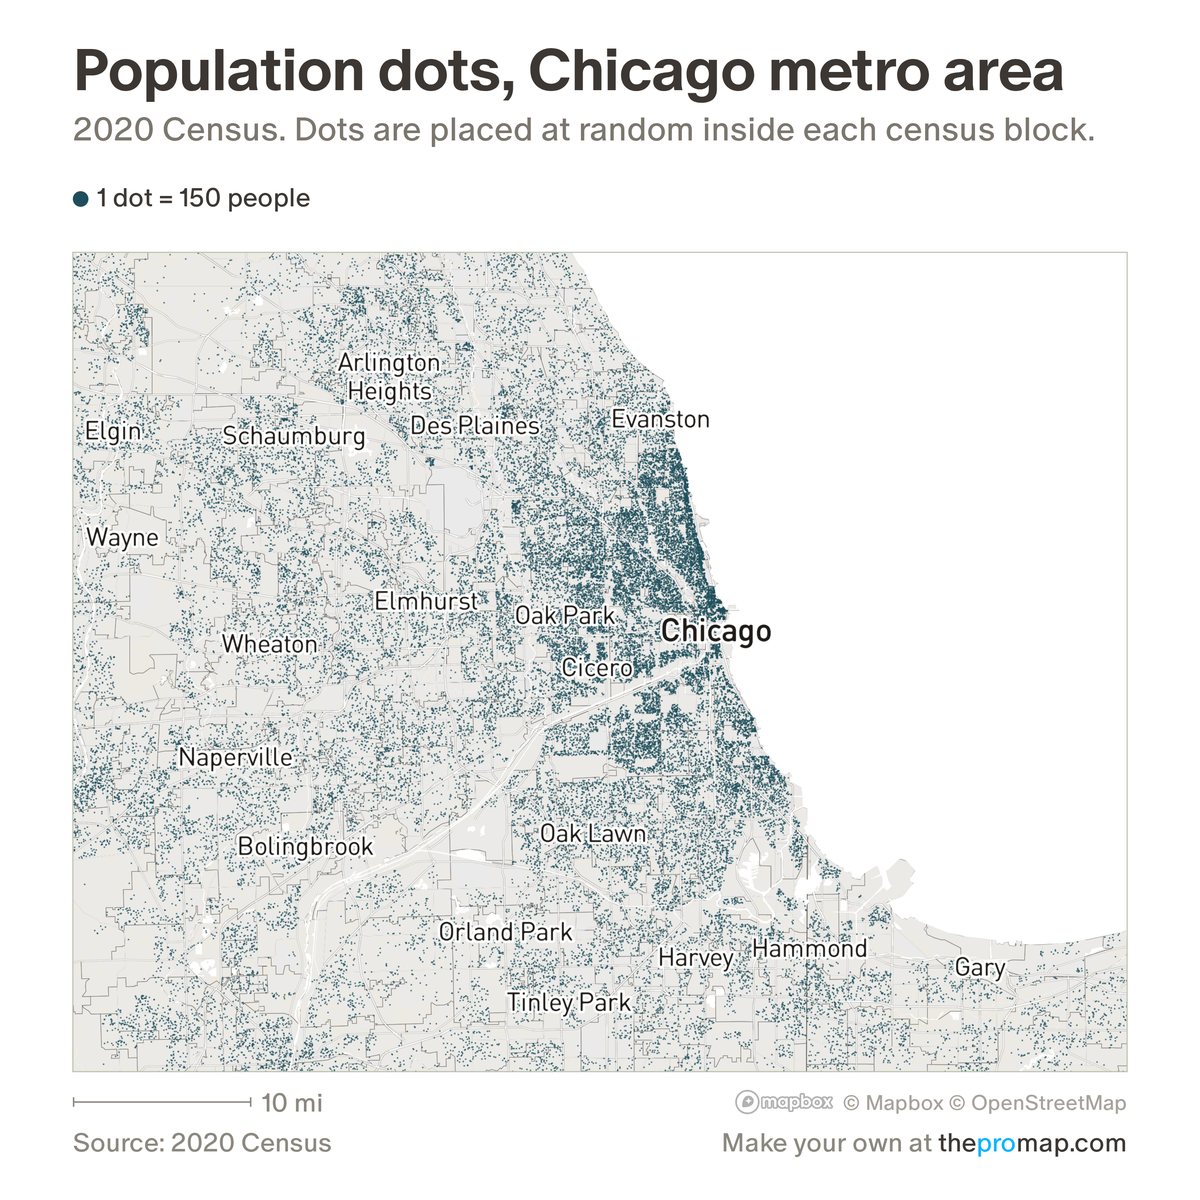
What this measure is
Each dot stands for the number of people shown under the legend, fewer per dot as you zoom in, as counted in the 2020 Census. Dots are placed at random inside the census block where those people live and kept off the streets, so they show where people live, not exact homes. In the race view, White, Black, Asian and other races are non-Hispanic, and Hispanic or Latino people can be of any race.
Source, dates and coverage
- Source
- Census Bureau, 2020 Census redistricting data; Census Bureau block and road maps.
- Updated
- Fixed: the 2020 Census.
- Areas on the map
- Census blocks (dots).
- Group
- Population
- Access
- ProMap Plus ($19 a month or $190 a year).
Values for every place
Population dots is a ProMap Plus measure. The map shows it for the areas listed above. This page shows the map's national picture, the method and the source, and no figures.
ProMap Plus costs $19 a month or $190 a year. A free 7-day trial is offered on the map.
See population dots in ProMap PlusHow to cite
Please also credit the original source: Census Bureau, 2020 Census redistricting data; Census Bureau block and road maps.