
FHA share of purchase loans by county
An interactive U.S. map of FHA share of purchase loans for states, metro areas, counties and census tracts. Latest data: 2025. PLUS
Open FHA share of purchase loans on the map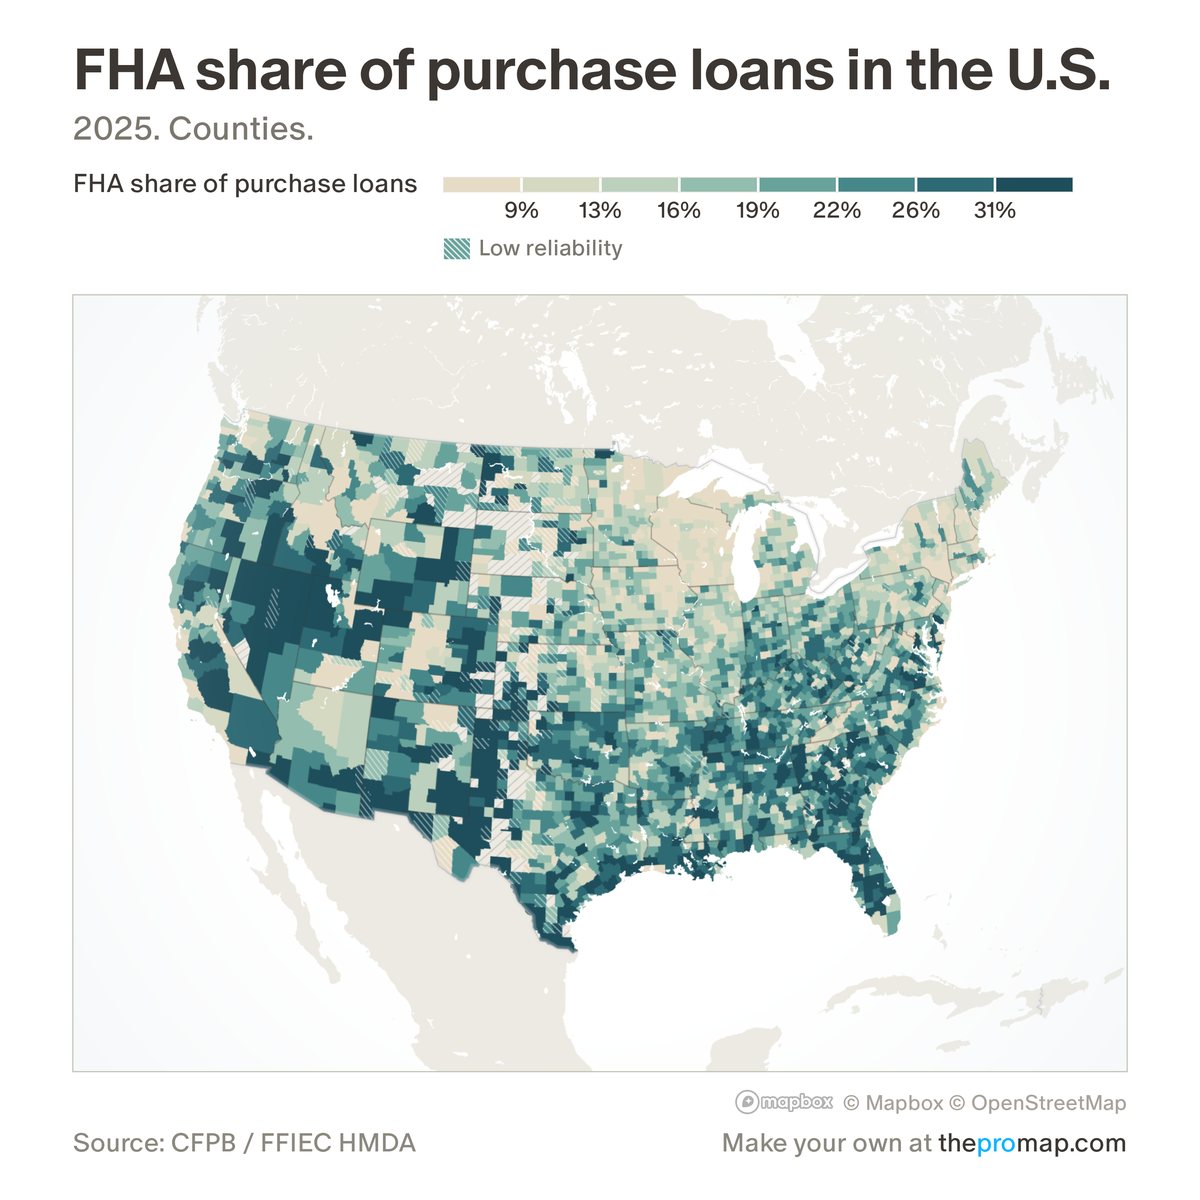
What this measure is
The share of home-purchase mortgages insured by the Federal Housing Administration, which allows low down payments and is often used by first-time buyers. It counts first-lien purchase loans on homes with one to four units. Buyers who pay cash leave no mortgage record and are not counted. White stripes over the colour mark low reliability: fewer than 30 loans.
Source, dates and coverage
- Source
- Consumer Financial Protection Bureau and Federal Financial Institutions Examination Council, Home Mortgage Disclosure Act loan records.
- Updated
- Once a year. Latest data on the map: 2025.
- Areas on the map
- States, metro areas, counties and census tracts.
- Group
- Mortgage lending (HMDA)
- Access
- ProMap Plus ($19 a month or $190 a year).
Values for every place
FHA share of purchase loans is a ProMap Plus measure. The map shows it for the areas listed above. This page shows the map's national picture, the method and the source, and no figures.
ProMap Plus costs $19 a month or $190 a year. A free 7-day trial is offered on the map.
See FHA share of purchase loans in ProMap PlusHow to cite
Please also credit the original source: Consumer Financial Protection Bureau and Federal Financial Institutions Examination Council, Home Mortgage Disclosure Act loan records.