
Investor share of purchase loans by county
An interactive U.S. map of investor share of purchase loans for states, metro areas, counties and census tracts. Latest data: 2025. PLUS
Open investor share of purchase loans on the map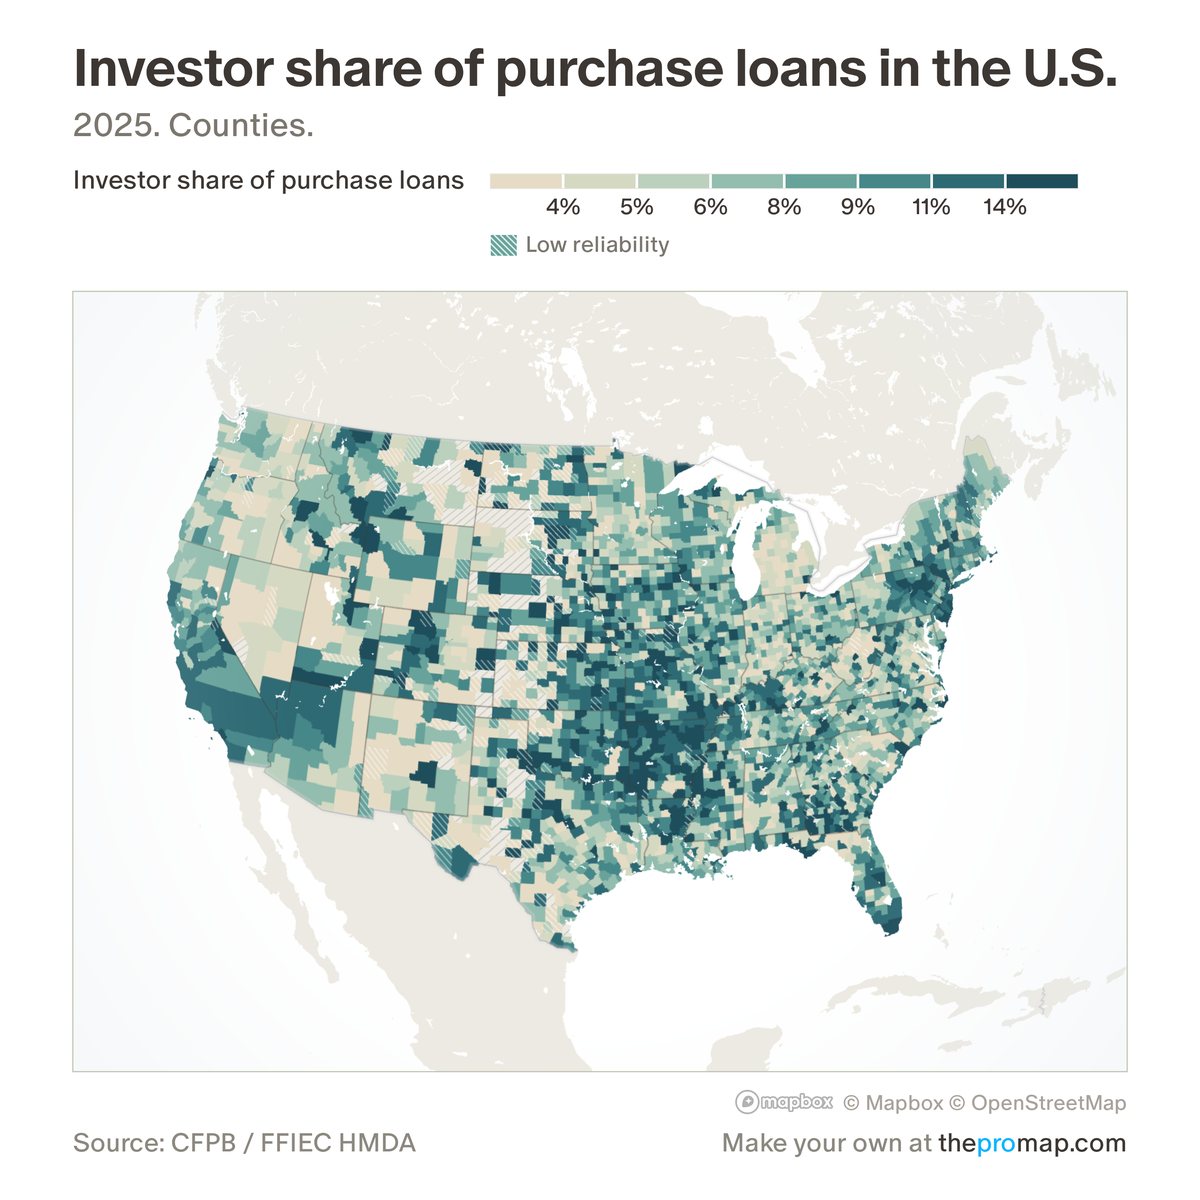
What this measure is
The share of home-purchase mortgages made to buyers who said they would not live in the home, meaning investors. It counts first-lien purchase loans on homes with one to four units. Buyers who pay cash leave no mortgage record and are not counted, so investors' share of all purchases is higher. White stripes over the colour mark low reliability: fewer than 30 loans.
Source, dates and coverage
- Source
- Consumer Financial Protection Bureau and Federal Financial Institutions Examination Council, Home Mortgage Disclosure Act loan records.
- Updated
- Once a year. Latest data on the map: 2025.
- Areas on the map
- States, metro areas, counties and census tracts.
- Group
- Mortgage lending (HMDA)
- Access
- ProMap Plus ($19 a month or $190 a year).
Values for every place
Investor share of purchase loans is a ProMap Plus measure. The map shows it for the areas listed above. This page shows the map's national picture, the method and the source, and no figures.
ProMap Plus costs $19 a month or $190 a year. A free 7-day trial is offered on the map.
See investor share of purchase loans in ProMap PlusHow to cite
Please also credit the original source: Consumer Financial Protection Bureau and Federal Financial Institutions Examination Council, Home Mortgage Disclosure Act loan records.