
Amenity score by ZIP code
An interactive U.S. map of amenity score for states, metro areas, counties and ZIP codes. PLUS
Open amenity score on the map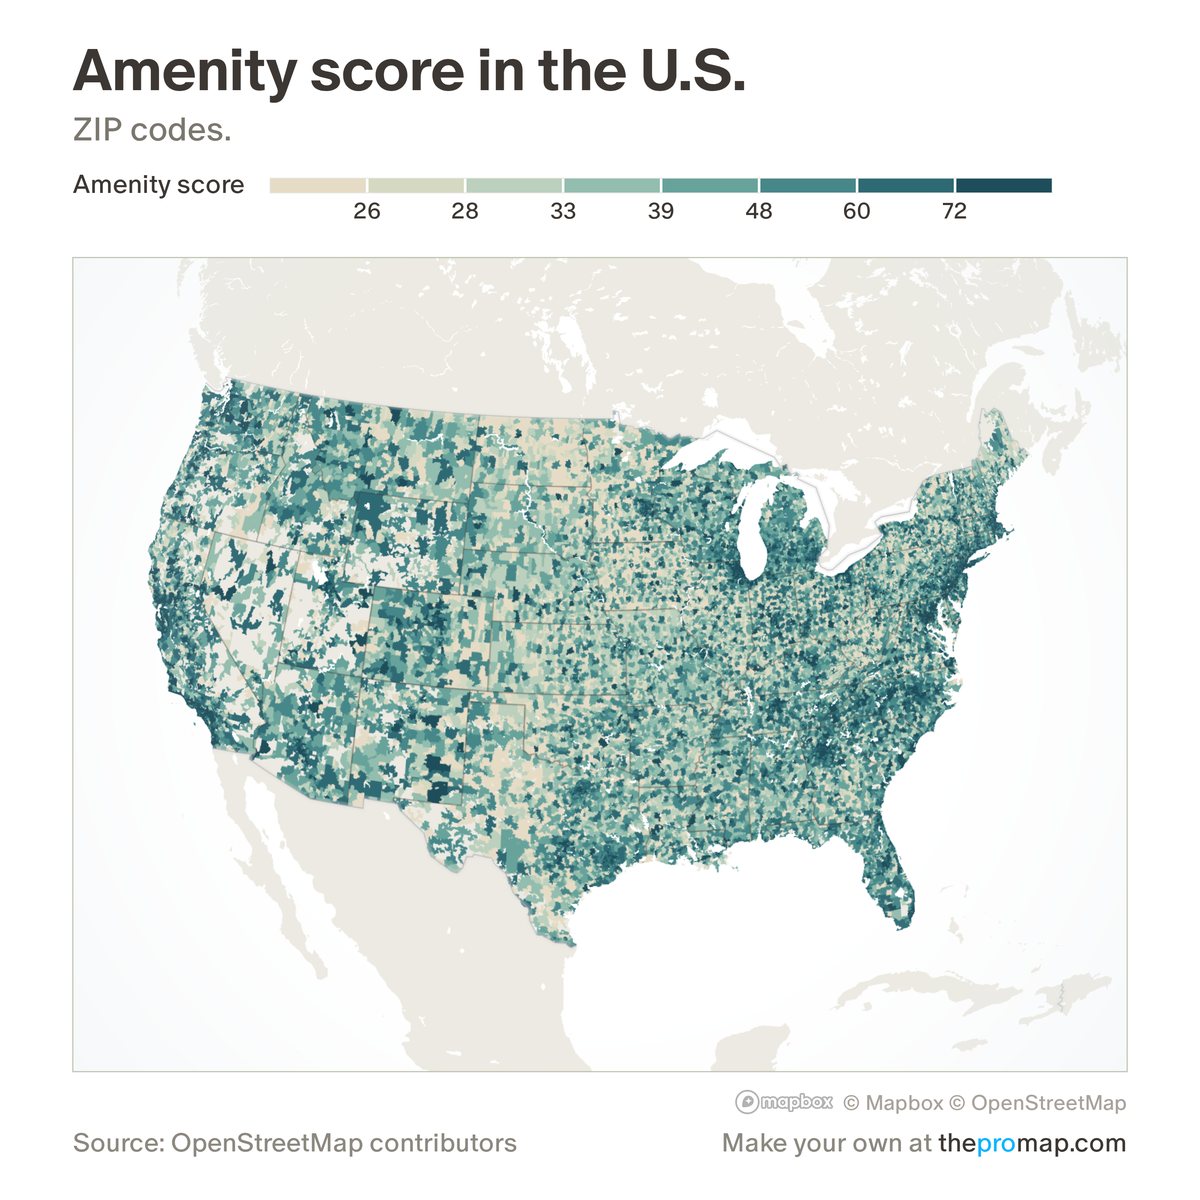
What this measure is
A 0–100 score for how many everyday places a ZIP code has, built from OpenStreetMap. Each kind of place is ranked against all ZIP codes, and the ranks are blended with fixed weights: restaurants 22%, grocery 20%, rail transit 16%, parks 14%, cafés 12%, schools and pharmacies 6% each, bars and gyms 2% each; rail transit counts by closeness to the nearest station, up to 10 miles. Counties, metros and states show the typical resident's ZIP: a population-weighted average of their ZIP codes. OpenStreetMap is mapped by volunteers, so coverage varies from place to place.
Source, dates and coverage
- Source
- OpenStreetMap contributors; Home Economics calculation.
- Updated
- Rebuilt once a year from a new OpenStreetMap download.
- Areas on the map
- States, metro areas, counties and ZIP codes.
- Group
- Amenities & transit
- Access
- ProMap Plus ($19 a month or $190 a year).
Values for every place
Amenity score is a ProMap Plus measure. The map shows it for the areas listed above. This page shows the map's national picture, the method and the source, and no figures.
ProMap Plus costs $19 a month or $190 a year. A free 7-day trial is offered on the map.
See amenity score in ProMap PlusHow to cite
Please also credit the original source: OpenStreetMap contributors; Home Economics calculation.