
Median days on market (Realtor.com) by ZIP code
An interactive U.S. map of median days on market (Realtor.com) for states, metro areas, counties and ZIP codes. Latest data: October 2026. PLUS
Open median days on market (Realtor.com) on the map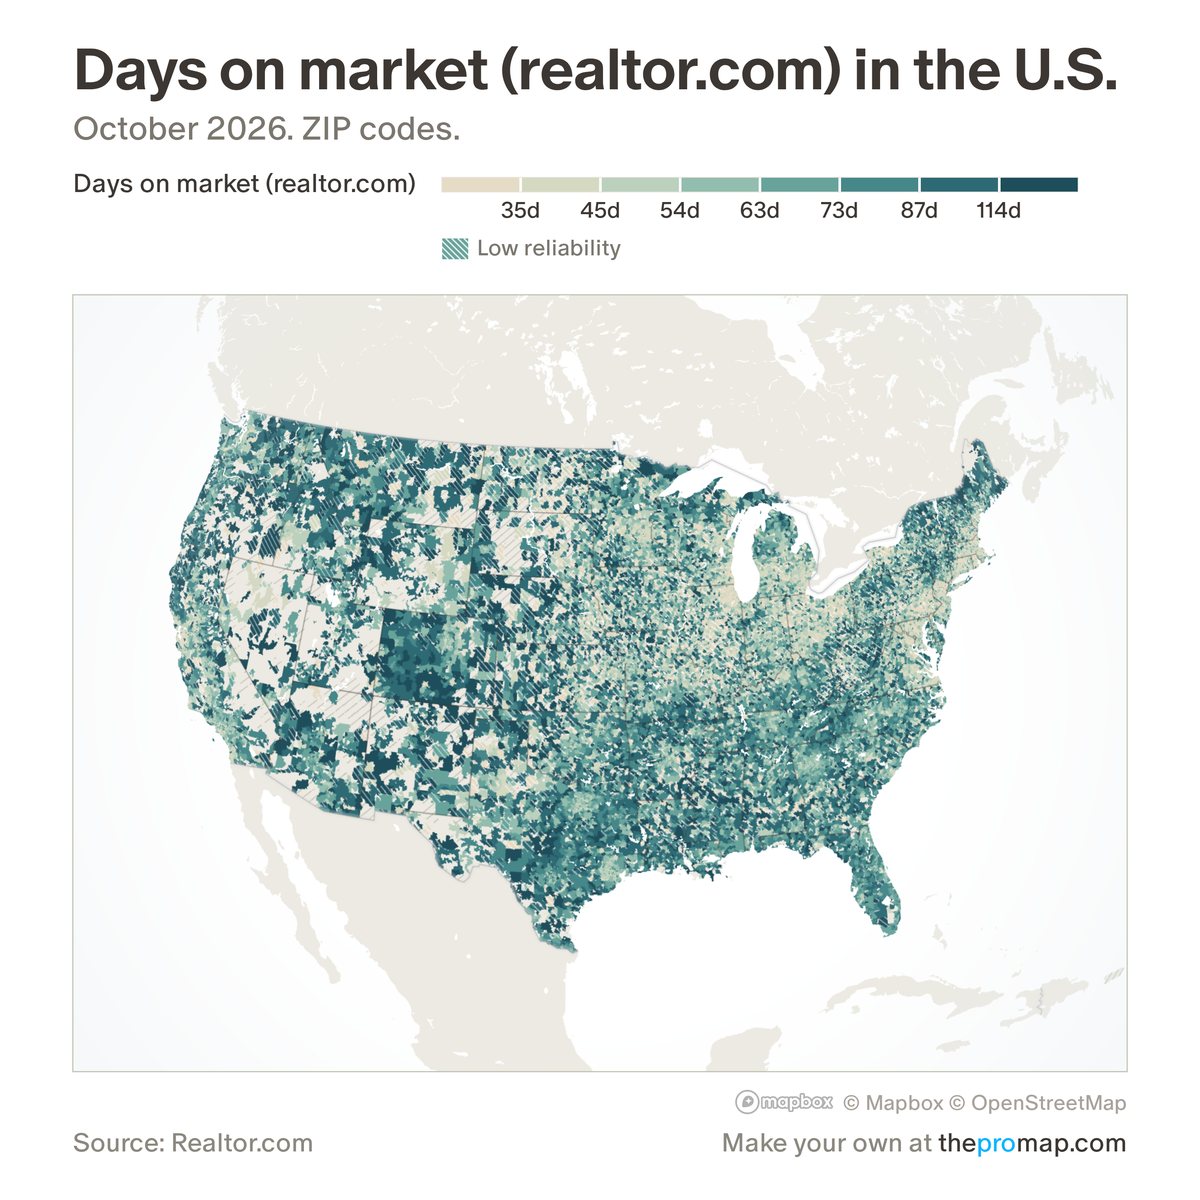
What this measure is
Realtor.com's median number of days on the market for homes listed for sale on its site in the month, seasonally adjusted. Connecticut's counties are hatched, because Realtor.com reports the state's planning regions instead. White stripes over the colour mark low reliability: fewer than 5 active listings.
Source, dates and coverage
- Source
- Realtor.com Economic Research, monthly inventory data.
- Updated
- Monthly. Latest data on the map: October 2026.
- Areas on the map
- States, metro areas, counties and ZIP codes.
- Group
- Housing data
- Access
- ProMap Plus ($19 a month or $190 a year).
Values for every place
Median days on market (Realtor.com) is a ProMap Plus measure. The map shows it for the areas listed above. This page shows the map's national picture, the method and the source, and no figures.
ProMap Plus costs $19 a month or $190 a year. A free 7-day trial is offered on the map.
See median days on market (Realtor.com) in ProMap PlusHow to cite
Please also credit the original source: Realtor.com Economic Research, monthly inventory data.
More housing data measures
- Home prices
- Rents
- Asking rents (Parcl Labs)
- Rental concessions
- Median sale price
- Median list price (new listings)
- Homes sold
- New listings
- For-sale inventory
- Listings with a price cut (Realtor.com)
- Months of supply
- Sale-to-list ratio
- Pending sales (by home type)
- Active listings (by home type)
- Days on market (by home type)
- Sold above list price