
Sale-to-list ratio by ZIP code
An interactive U.S. map of sale-to-list ratio for states, metro areas, counties and ZIP codes. Latest data: September 2026. PLUS
Open sale-to-list ratio on the map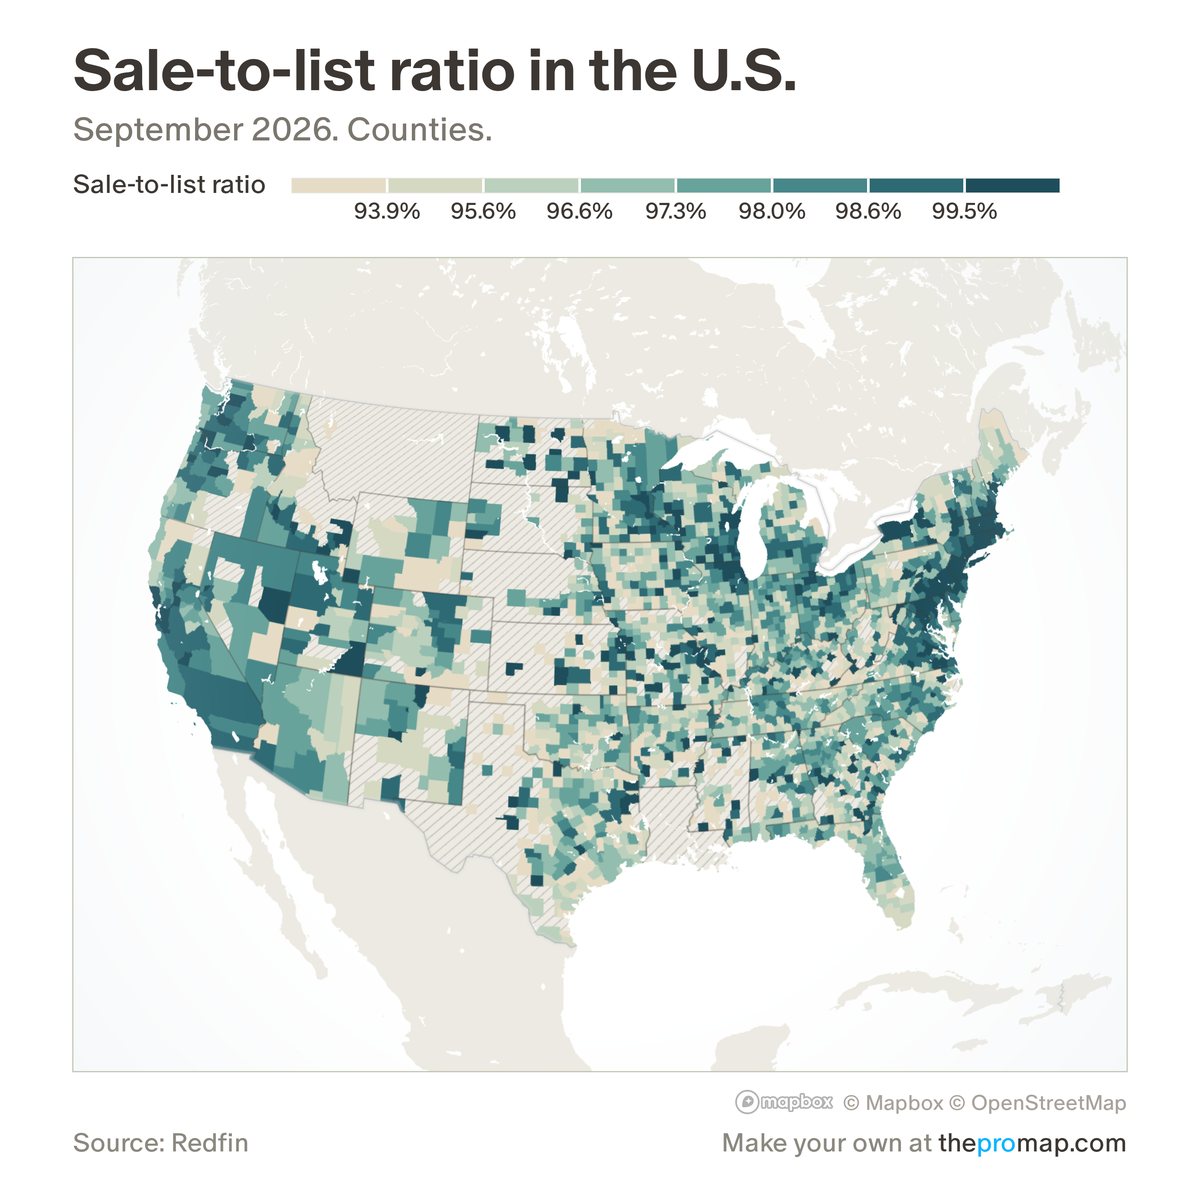
What this measure is
Redfin's average of each sold home's sale price as a share of its list price. Above 100% means homes typically sold for more than the asking price. Areas with fewer than 5 sales a month for six months or more are hatched. For a single home type, white stripes over the colour mark low reliability: fewer than 25 sales of that home type a month.
Source, dates and coverage
- Source
- Redfin Data Center.
- Updated
- Monthly. Latest data on the map: September 2026.
- Areas on the map
- States, metro areas, counties and ZIP codes.
- Group
- Housing data
- Access
- ProMap Plus ($19 a month or $190 a year).
Values for every place
Sale-to-list ratio is a ProMap Plus measure. The map shows it for the areas listed above. This page shows the map's national picture, the method and the source, and no figures.
ProMap Plus costs $19 a month or $190 a year. A free 7-day trial is offered on the map.
See sale-to-list ratio in ProMap PlusHow to cite
Please also credit the original source: Redfin Data Center.
More housing data measures
- Home prices
- Rents
- Asking rents (Parcl Labs)
- Rental concessions
- Median sale price
- Median list price (new listings)
- Homes sold
- New listings
- For-sale inventory
- Median days on market (Realtor.com)
- Listings with a price cut (Realtor.com)
- Months of supply
- Pending sales (by home type)
- Active listings (by home type)
- Days on market (by home type)
- Sold above list price