ProMap › Measures › Rents Rents by ZIP code An interactive U.S. map of rents for states, metro areas, counties, cities and ZIP codes. Latest data: September 2026. FREE
Open rents on the map →
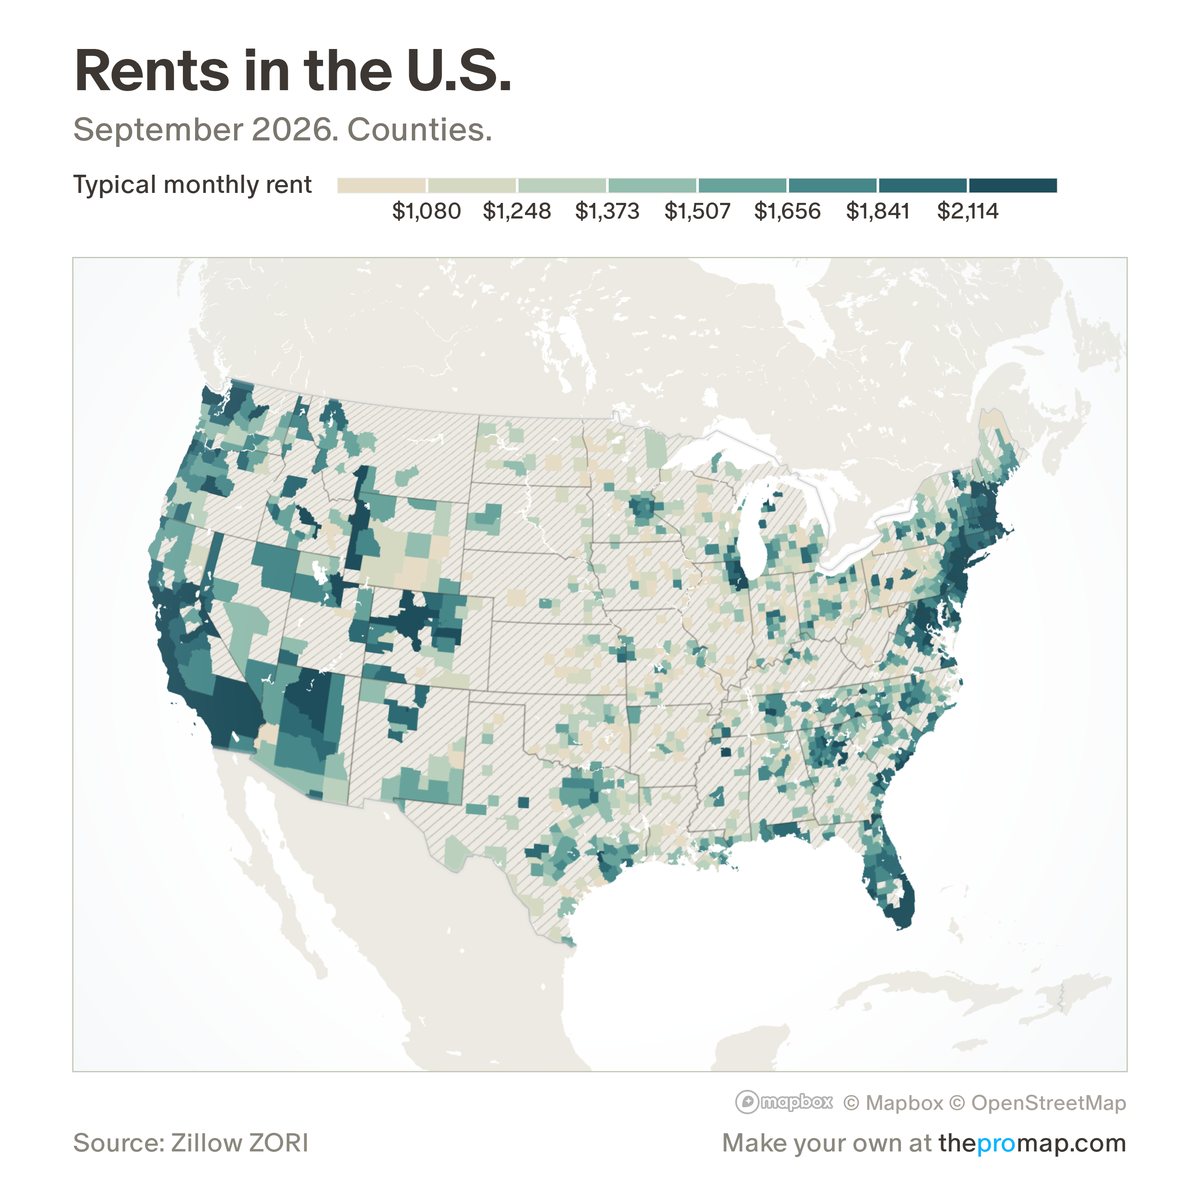
Rents in the U.S. September 2026. Counties. Source: Zillow ZORI (Sep 2026), seasonally adjusted (Zillow). Map: ProMap, Home Economics. What this measure is The typical monthly rent: Zillow's index of rents asked for homes listed for rent, seasonally adjusted. It describes rents for new leases, not what sitting tenants pay. Single-family and multifamily rents are published for metro areas only.
Source, dates and coverage Source Zillow Observed Rent Index. Updated Monthly. Latest data on the map: September 2026. Areas on the map States, metro areas, counties, cities and ZIP codes. Group Housing data Access Free on the map. Rents: highest and lowest places, September 2026 Typical monthly rent, Zillow ZORI (Sep 2026), seasonally adjusted (Zillow). U.S.: $1,932 (+2.9% in a year). Each place links to its own page.
States (51 with a figure) Highest State Typical monthly rent 1-year change Hawaii $3,044 +5.5% New York $2,888 +2.9% California $2,803 +4.0% Massachusetts $2,626 +2.7% New Jersey $2,506 +2.6% District of Columbia $2,484 +1.1% Rhode Island $2,237 +5.0% Connecticut $2,234 New Hampshire $2,179 +2.3% Florida $2,115 +1.3%
Lowest State Typical monthly rent 1-year change North Dakota $1,185 +2.3% Iowa $1,208 +1.9% West Virginia $1,223 +0.9% Arkansas $1,300 +0.3% South Dakota $1,306 +5.9% Oklahoma $1,310 +0.5% Nebraska $1,347 +0.2% Indiana $1,367 +2.2% Kentucky $1,373 +2.2% Kansas $1,375 +3.3%
Metro areas (716 with a figure) Highest Metro area Typical monthly rent 1-year change Kapaa, HI $4,456 +14.9% San Jose-Sunnyvale-Santa Clara, CA $3,812 +8.5% Key West-Key Largo, FL $3,671 −0.3% New York-Newark-Jersey City, NY-NJ $3,546 +4.3% Santa Cruz-Watsonville, CA $3,469 +4.3% Jackson, WY-ID $3,458 +5.1% San Francisco-Oakland-Fremont, CA $3,445 +11.8% Edwards, CO $3,410 +6.2% Breckenridge, CO $3,349 +1.6% Santa Maria-Santa Barbara, CA $3,279 +3.3%
Lowest Metro area Typical monthly rent 1-year change Price, UT $692 Emporia, KS $718 −1.6% Sterling, IL $769 Charleston-Mattoon, IL $771 Fort Dodge, IA $782 +7.8% Bluefield, WV-VA $786 +5.2% Huntington, IN $788 Logansport, IN $795 Great Bend, KS $798 Lewistown, PA $800
Counties (1,366 with a figure) Highest County Typical monthly rent 1-year change Pitkin County, CO $12,105 +11.7% San Francisco County, CA $4,784 +26.3% New York County, NY $4,779 +5.8% Kauai County, HI $4,456 +14.9% Teton County, WY $4,327 San Mateo County, CA $3,993 +11.2% Marin County, CA $3,865 +8.0% Kings County, NY $3,858 +5.4% Santa Clara County, CA $3,817 +8.6% Monroe County, FL $3,671 −0.3%
Lowest County Typical monthly rent 1-year change Carbon County, UT $692 Jackson County, IL $692 +4.6% Humboldt County, IA $700 Lyon County, KS $718 −2.2% La Paz County, AZ $757 Benton County, IA $762 Whiteside County, IL $769 Coles County, IL $771 Mercer County, WV $772 +4.2% Jefferson County, OH $773 +9.0%
ZIP codes (8,315 with a figure, 1,000 or more residents) Highest ZIP code Typical monthly rent 1-year change 11976 (Water Mill, NY) $65,167 11963 (Sag Harbor, NY) $50,500 +10.0% 11937 (East Hampton, NY) $39,147 +11.1% 11968 (Southampton, NY) $35,528 +26.4% 11954 (Montauk, NY) $27,500 81611 (Aspen, CO) $17,626 +10.6% 90077 (Bel-Air, Los Angeles, CA) $13,742 +2.9% 93108 (Montecito, CA) $13,333 +10.2% 90265 (Malibu, CA) $13,161 +5.6% 90272 (Pacific Palisades, Los Angeles, CA) $12,849 +18.0%
Lowest ZIP code Typical monthly rent 1-year change 62901 (Carbondale, IL) $636 +5.3% 74601 (Ponca City, OK) $665 +3.0% 43952 (Steubenville, OH) $696 66801 (Emporia, KS) $718 −1.7% 46750 (Huntington, IN) $725 74948 (Muldrow, OK) $725 67501 (Hutchinson, KS) $738 +4.4% 78003 (Bandera, TX) $750 67530 (Great Bend, KS) $756 52807 (Davenport, IA) $758 +8.9%
Download every state, metro area and county: states (CSV, 51 rows) , metro areas (CSV, 925 rows) , counties (CSV, 3,071 rows) . Free to quote with a link; see the licence .
How to cite Home Economics (Aziz Sunderji), ProMap, “Rents”, https://homeeconomics.us/promap/measure/rents, accessed 15 November 2026.
Please also credit the original source: Zillow Observed Rent Index.
More housing data measures All 139 measures · What ProMap is