ProMap › Measures › Home prices Home prices by ZIP code An interactive U.S. map of home prices for states, metro areas, counties, cities, ZIP codes and census tracts. Latest data: September 2026. FREE
Open home prices on the map →
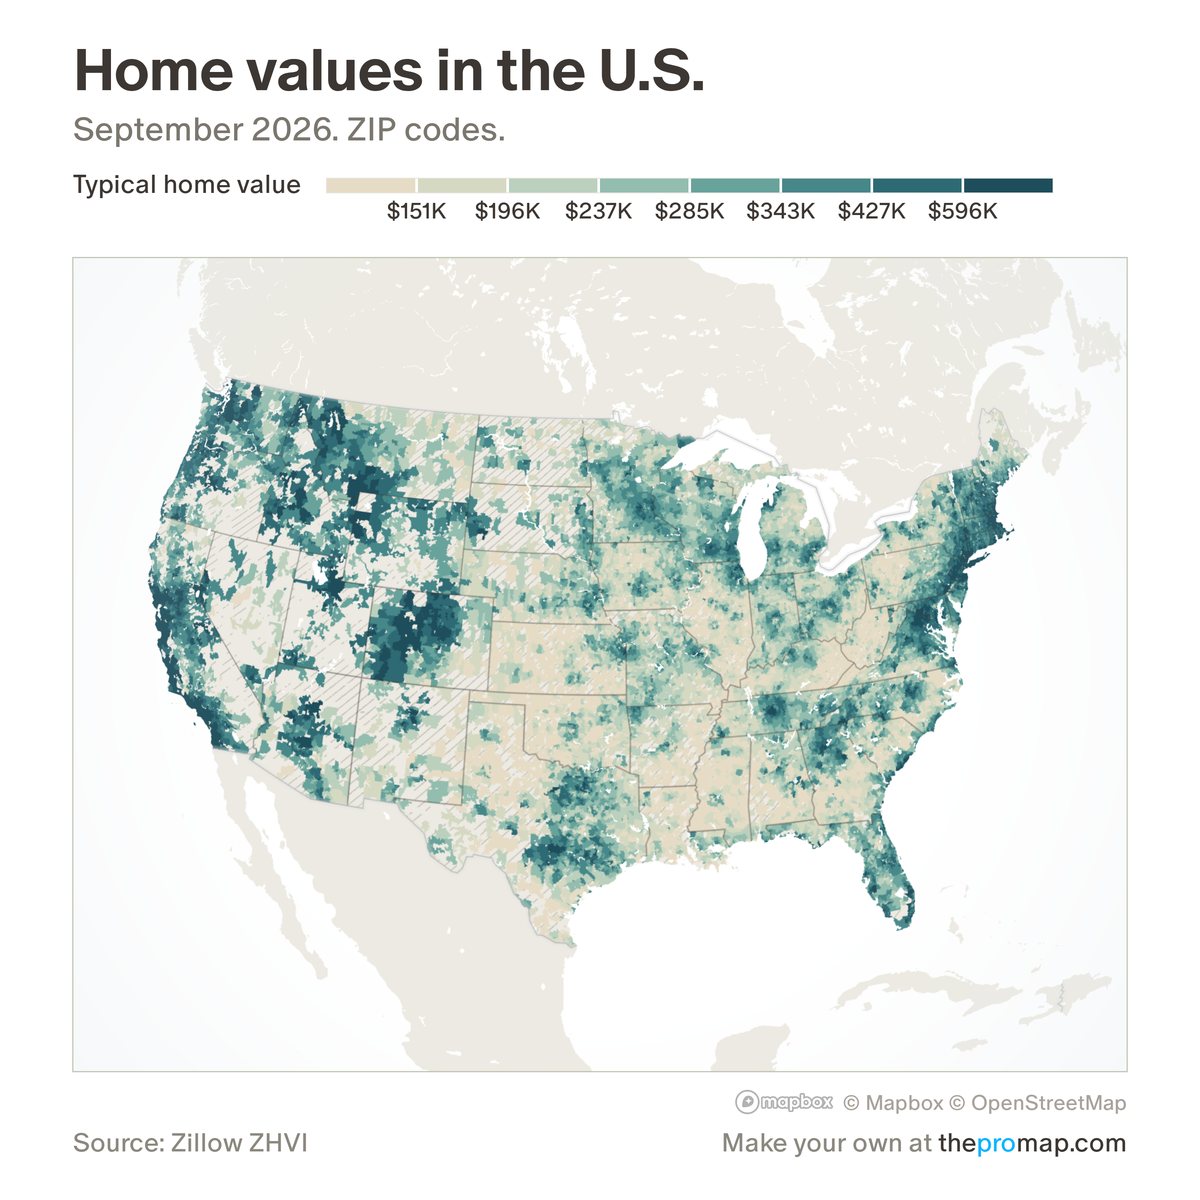
Home values in the U.S. September 2026. ZIP codes. Source: Zillow ZHVI. Map: ProMap, Home Economics. What this measure is The typical home value: Zillow's estimate for homes in the middle third of values, smoothed and seasonally adjusted. It is an estimate of what homes are worth, not a median of the homes that sold. Single-family and condo values are separate choices under property type. Census tract values are estimates: Census Bureau survey values scaled so that each county matches its Zillow value.
Source, dates and coverage Source Zillow Home Value Index. Updated Monthly. Latest data on the map: September 2026. Areas on the map States, metro areas, counties, cities, ZIP codes and census tracts. Group Housing data Access Free on the map. Home prices: highest and lowest places, September 2026 Typical home value, Zillow ZHVI (Sep 2026). U.S.: $366,157 (+1.2% in a year). Each place links to its own page.
States (51 with a figure) Highest State Typical home value 1-year change Hawaii $832,932 +1.4% California $761,538 +0.6% Massachusetts $655,219 +2.3% Washington $587,533 −0.5% New Jersey $575,123 +4.0% District of Columbia $567,271 −0.7% Utah $532,920 +1.2% Colorado $529,013 −1.3% New York $524,942 +5.6% New Hampshire $510,937 +2.9%
Lowest State Typical home value 1-year change West Virginia $176,576 +2.6% Mississippi $194,531 +2.2% Louisiana $213,867 +2.1% Oklahoma $220,801 +2.6% Arkansas $224,158 +3.4% Kentucky $230,909 −0.2% Iowa $236,623 +3.3% Alabama $238,614 +1.9% Ohio $245,982 +3.2% Kansas $246,055 +3.5%
Metro areas (925 with a figure) Highest Metro area Typical home value 1-year change Nantucket, MA $3,186,894 +9.5% Vineyard Haven, MA $1,556,422 +6.1% San Jose-Sunnyvale-Santa Clara, CA $1,523,615 +0.2% Jackson, WY-ID $1,437,098 +4.7% Rifle, CO $1,401,646 +7.3% Edwards, CO $1,297,196 +2.9% Heber, UT $1,143,939 +4.1% Santa Cruz-Watsonville, CA $1,136,154 +4.8% Steamboat Springs, CO $1,121,758 +4.0% San Francisco-Oakland-Fremont, CA $1,120,379 +3.1%
Lowest Metro area Typical home value 1-year change Greenville, MS $53,678 −2.4% Clarksdale, MS $59,852 +3.5% Forrest City, AR $77,402 −2.1% Selma, AL $84,788 +3.4% Pikeville, KY $93,048 −11.7% Kennett, MO $94,970 +7.5% Middlesborough, KY $99,037 −13.0% Greenwood, MS $99,504 −4.6% Macomb, IL $101,314 +3.4% Danville, IL $101,326 +3.0%
Counties (3,071 with a figure) Highest County Typical home value 1-year change Nantucket County, MA $3,186,894 +9.5% Pitkin County, CO $2,710,408 +9.4% Teton County, WY $2,266,786 +4.5% San Miguel County, CO $1,644,020 +9.0% San Mateo County, CA $1,579,058 +4.4% Santa Clara County, CA $1,562,682 +0.3% Dukes County, MA $1,556,392 +6.1% Marin County, CA $1,484,731 +4.8% San Francisco County, CA $1,441,170 +15.5% Summit County, UT $1,334,757 +5.6%
Lowest County Typical home value 1-year change McDowell County, WV $37,466 −16.0% Phillips County, AR $46,192 −4.1% Cochran County, TX $51,155 −7.7% Washington County, MS $53,685 −2.4% Harmon County, OK $55,800 −18.4% Tillman County, OK $56,930 −7.0% Letcher County, KY $58,973 −16.5% East Carroll Parish, LA $59,633 −6.8% Alexander County, IL $59,675 −14.6% Coahoma County, MS $59,820 +3.5%
ZIP codes (21,894 with a figure, 1,000 or more residents) Highest ZIP code Typical home value 1-year change 94027 (Atherton, CA) $8,728,581 +16.0% 33109 (Miami Beach, FL) $6,993,067 +9.7% 92657 (Newport Beach, CA) $5,547,445 +8.6% 90210 (Beverly Crest, Beverly Hills, CA) $5,308,261 +10.3% 93108 (Montecito, CA) $5,168,106 +12.3% 11976 (Water Mill, NY) $5,118,764 +8.3% 94022 (Los Altos, CA) $5,059,469 +8.4% 90402 (Pacific Palisades, Santa Monica, CA) $4,852,569 +12.7% 92067 (North City, Rancho Santa Fe, CA) $4,791,113 +6.7% 92661 (Newport Beach, CA) $4,704,738 +15.0%
Lowest ZIP code Typical home value 1-year change 48505 (Flint, MI) $29,189 −7.3% 71103 (Shreveport, LA) $30,619 +0.1% 24892 (War, WV) $31,749 −14.9% 62205 (East Saint Louis, IL) $32,264 +3.9% 62204 (East Saint Louis, IL) $33,645 −4.6% 44506 (Youngstown, OH) $35,434 +6.8% 63120 (Mark Twain, Saint Louis, MO) $36,190 +1.9% 36610 (Prichard, AL) $36,359 −1.5% 72390 (Helena - West Helena, AR) $36,674 −3.7% 71601 (Pine Bluff, AR) $37,682 −10.7%
Download every state, metro area and county: states (CSV, 51 rows) , metro areas (CSV, 925 rows) , counties (CSV, 3,071 rows) . Free to quote with a link; see the licence .
How to cite Home Economics (Aziz Sunderji), ProMap, “Home prices”, https://homeeconomics.us/promap/measure/home-prices, accessed 15 November 2026.
Please also credit the original source: Zillow Home Value Index.
More housing data measures All 139 measures · What ProMap is