
Fatal crashes (dots)
An interactive U.S. map of fatal crashes (dots) for individual crashes. PLUS
Open fatal crashes (dots) on the map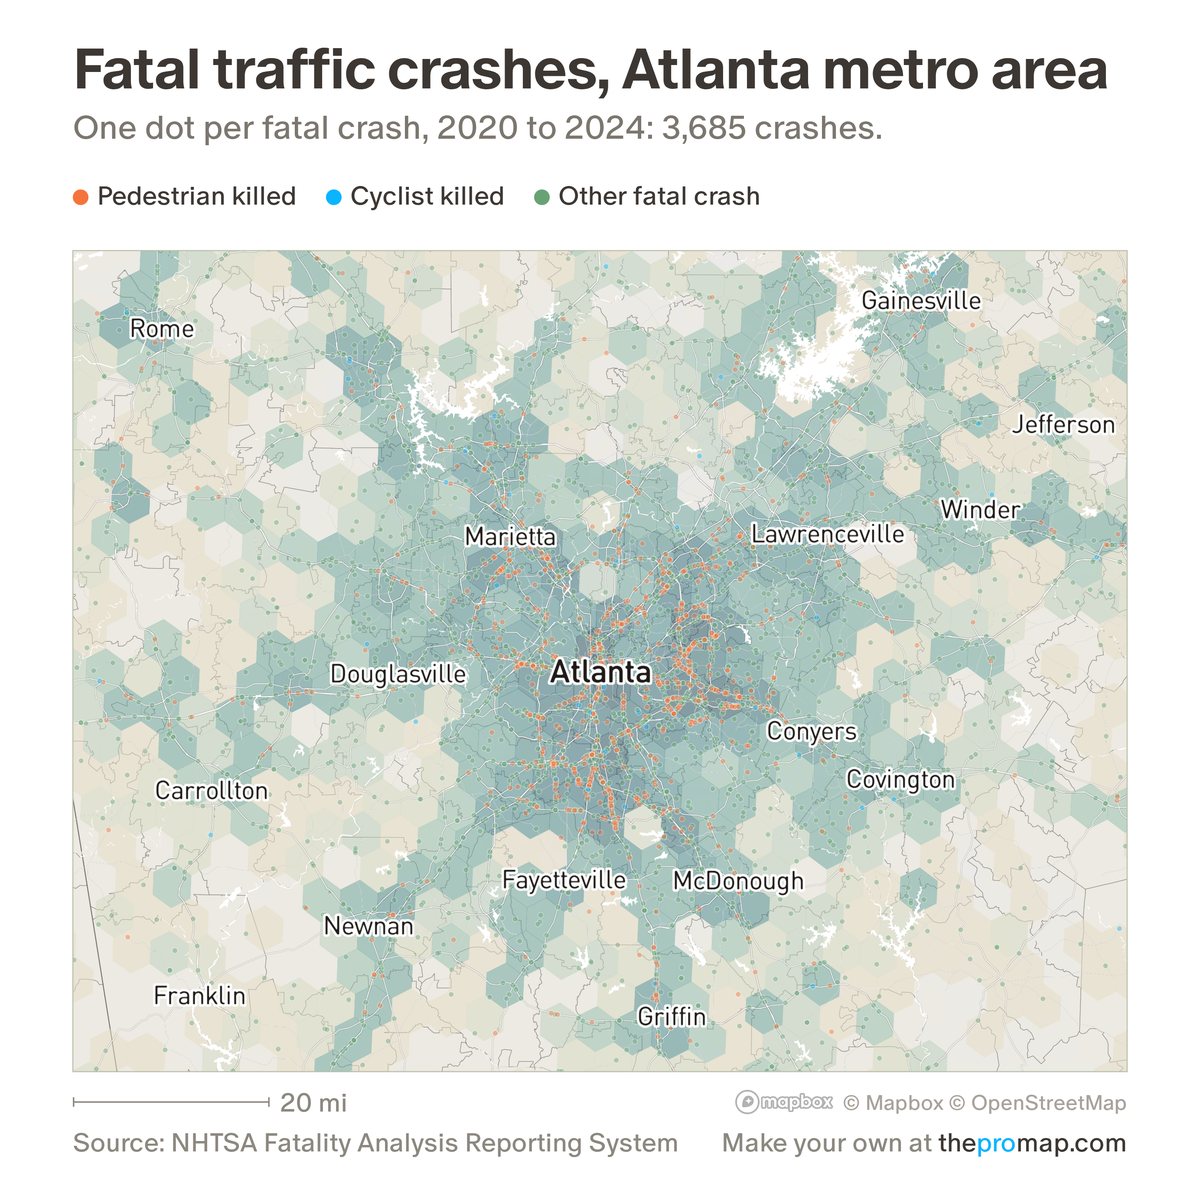
What this measure is
One dot for every motor-vehicle crash on a public road in which someone died within 30 days, at the location police reported, for the years you choose under the legend (2020–2024 to start; locations exist from 2001). Red marks a crash in which a pedestrian was killed, blue a cyclist, and green everyone else. Zoomed out, the dots become counts per hexagon, which follow population and road traffic; for risk per resident, use the crash-rate layers. Crashes with no reported location are left out.
Source, dates and coverage
- Source
- National Highway Traffic Safety Administration, Fatality Analysis Reporting System.
- Updated
- Crash records to 2024. The 2024 figures become final in early 2027.
- Areas on the map
- Individual crashes.
- Group
- Safety
- Access
- ProMap Plus ($19 a month or $190 a year).
Values for every place
Fatal crashes (dots) is a ProMap Plus measure. The map shows it for the areas listed above. This page shows the map's national picture, the method and the source, and no figures.
ProMap Plus costs $19 a month or $190 a year. A free 7-day trial is offered on the map.
See fatal crashes (dots) in ProMap PlusHow to cite
Please also credit the original source: National Highway Traffic Safety Administration, Fatality Analysis Reporting System.
More safety measures
- Violent crime per 1,000 residents and workers
- Property crime per 1,000 residents and workers
- Violent crime per 1,000 residents
- Property crime per 1,000 residents
- Violent crime, change 2019 to 2025
- Property crime, change 2019 to 2025
- Fatal crashes per 100,000 residents
- Pedestrians killed per 100,000 residents
- Fatal crash rate: change
- Pedestrian death rate: change