
Property crime per 1,000 residents and workers by ZIP code
An interactive U.S. map of property crime per 1,000 residents and workers for cities, ZIP codes and census tracts. PLUS
Open property crime per 1,000 residents and workers on the map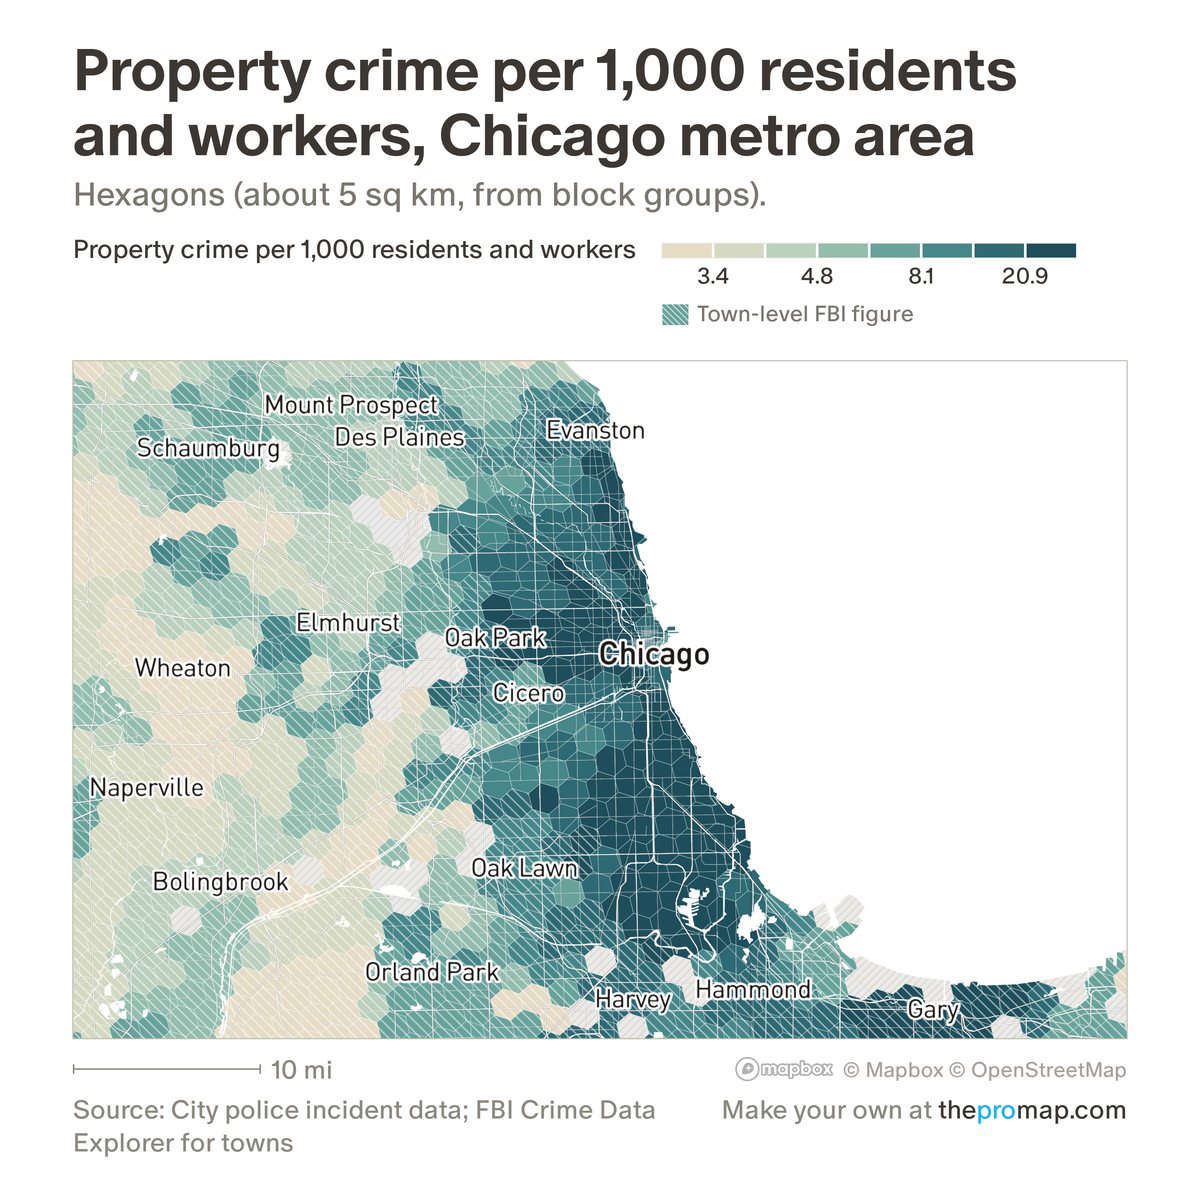
What this measure is
Property crimes reported to police each year (burglary, larceny-theft and motor vehicle theft) per 1,000 people who live or work in the area: 2020 Census residents plus the jobs located there. Counting workers keeps downtowns and job centres, where few people live but many spend the day, from looking more dangerous than they are. Inside cities that publish police incident data, figures are the yearly average for 2023–25; elsewhere in the largest metros, a town takes its police department's FBI figure. White stripes mark a town-level FBI figure: one figure for the whole town, not neighbourhood detail.
Source, dates and coverage
- Source
- Police incident data from each city that publishes it; FBI Crime Data Explorer; Census Bureau population and workplace job counts.
- Updated
- Built in November 2026 from incident data through 2025; not updated on a schedule.
- Areas on the map
- Cities, ZIP codes and census tracts.
- Group
- Safety
- Access
- ProMap Plus ($19 a month or $190 a year).
Values for every place
Property crime per 1,000 residents and workers is a ProMap Plus measure. The map shows it for the areas listed above. This page shows the map's national picture, the method and the source, and no figures.
ProMap Plus costs $19 a month or $190 a year. A free 7-day trial is offered on the map.
See property crime per 1,000 residents and workers in ProMap PlusHow to cite
Please also credit the original source: Police incident data from each city that publishes it; FBI Crime Data Explorer; Census Bureau population and workplace job counts.
More safety measures
- Violent crime per 1,000 residents and workers
- Violent crime per 1,000 residents
- Property crime per 1,000 residents
- Violent crime, change 2019 to 2025
- Property crime, change 2019 to 2025
- Fatal crashes per 100,000 residents
- Pedestrians killed per 100,000 residents
- Fatal crash rate: change
- Pedestrian death rate: change
- Fatal crashes (dots)