
Pedestrians killed per 100,000 residents by ZIP code
An interactive U.S. map of pedestrians killed per 100,000 residents for states, metro areas, counties and ZIP codes. Latest data: Yearly average, 2015–24. PLUS
Open pedestrians killed per 100,000 residents on the map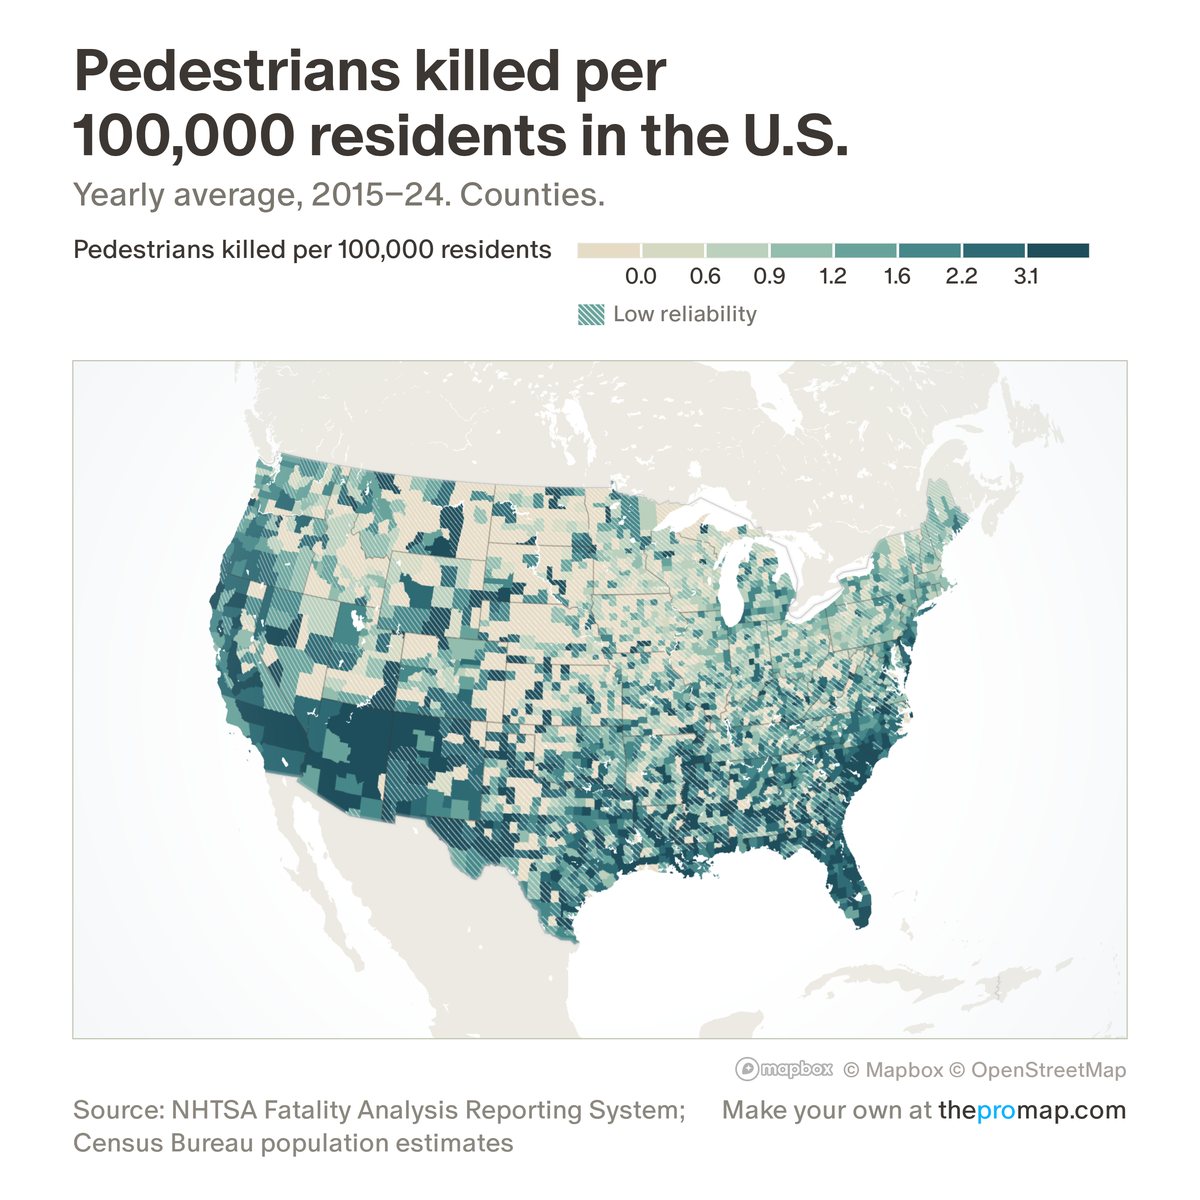
What this measure is
Pedestrians killed in traffic crashes per 100,000 residents per year, for the years you choose under the colour scale (2015–2024 to start); cyclists are not included. Deaths are counted where the crash happened, so places with busy roads and few residents read high. Road deaths rose after 2020, so an average over years on both sides of 2020 blends two periods. White stripes over the colour mark low reliability: fewer than 10 pedestrian deaths in the years chosen (30 for ZIP codes).
Source, dates and coverage
- Source
- National Highway Traffic Safety Administration, Fatality Analysis Reporting System; Census Bureau population estimates.
- Updated
- Crash records from 1975 to 2024 (ZIP codes from 2001). The 2024 figures become final in early 2027. Latest data on the map: Yearly average, 2015–24.
- Areas on the map
- States, metro areas, counties and ZIP codes.
- Group
- Safety
- Access
- ProMap Plus ($19 a month or $190 a year).
Values for every place
Pedestrians killed per 100,000 residents is a ProMap Plus measure. The map shows it for the areas listed above. This page shows the map's national picture, the method and the source, and no figures.
ProMap Plus costs $19 a month or $190 a year. A free 7-day trial is offered on the map.
See pedestrians killed per 100,000 residents in ProMap PlusHow to cite
Please also credit the original source: National Highway Traffic Safety Administration, Fatality Analysis Reporting System; Census Bureau population estimates.
More safety measures
- Violent crime per 1,000 residents and workers
- Property crime per 1,000 residents and workers
- Violent crime per 1,000 residents
- Property crime per 1,000 residents
- Violent crime, change 2019 to 2025
- Property crime, change 2019 to 2025
- Fatal crashes per 100,000 residents
- Fatal crash rate: change
- Pedestrian death rate: change
- Fatal crashes (dots)