
House vote margin, 2026 by county
An interactive U.S. map of House vote margin, 2026 for states, metro areas and counties. Latest data: 2026. PLUS
Open House vote margin, 2026 on the map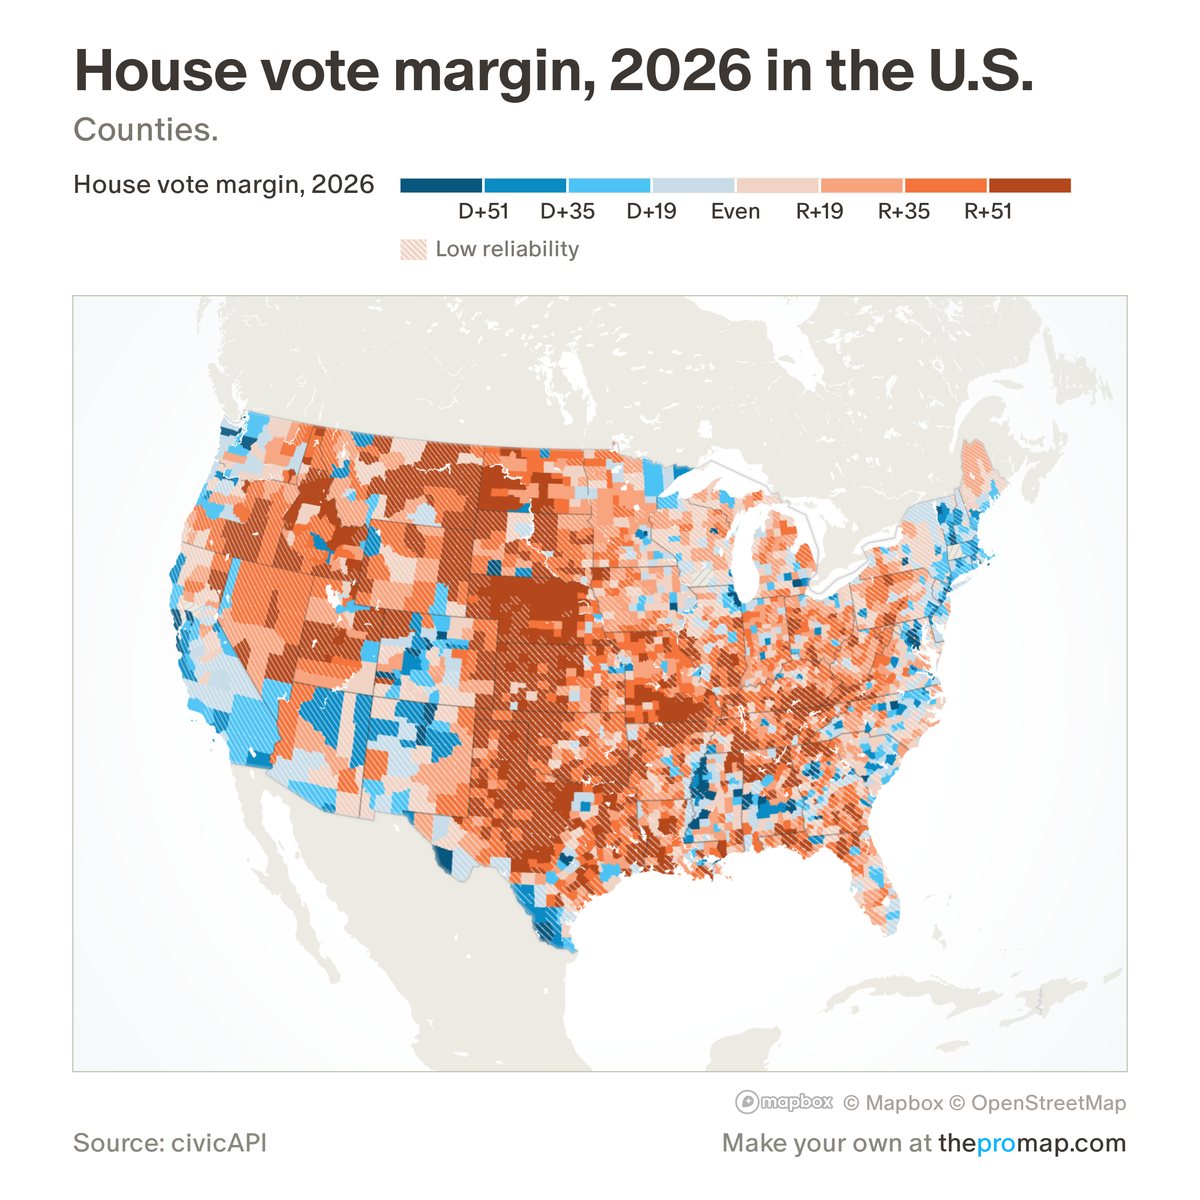
What this measure is
Votes for Republican House candidates minus votes for Democratic candidates, as a share of the two parties' votes, in percentage points: R+10 means Republicans won the area's House vote by 10 points, D+10 Democrats. Only districts with both a Democrat and a Republican on the ballot count, and a county split between districts adds its votes in each. These are unofficial results still being counted, so figures move as late ballots are added and certified results can differ. White stripes over the colour mark low reliability: under 95% of precincts reporting, or part of the area in an uncontested district.
Source, dates and coverage
- Source
- civicAPI (civicapi.org), which gathers state and county election-night reporting.
- Updated
- Refreshed while votes are being counted; the legend gives the time of the latest count. Latest data on the map: 2026.
- Areas on the map
- States, metro areas and counties.
- Group
- Politics
- Access
- ProMap Plus ($19 a month or $190 a year).
Values for every place
House vote margin, 2026 is a ProMap Plus measure. The map shows it for the areas listed above. This page shows the map's national picture, the method and the source, and no figures.
ProMap Plus costs $19 a month or $190 a year. A free 7-day trial is offered on the map.
See House vote margin, 2026 in ProMap PlusHow to cite
Please also credit the original source: civicAPI (civicapi.org), which gathers state and county election-night reporting.