
Shift in House margin, 2024 to 2026 by county
An interactive U.S. map of shift in House margin, 2024 to 2026 for states, metro areas and counties. Latest data: 2026. PLUS
Open shift in House margin, 2024 to 2026 on the map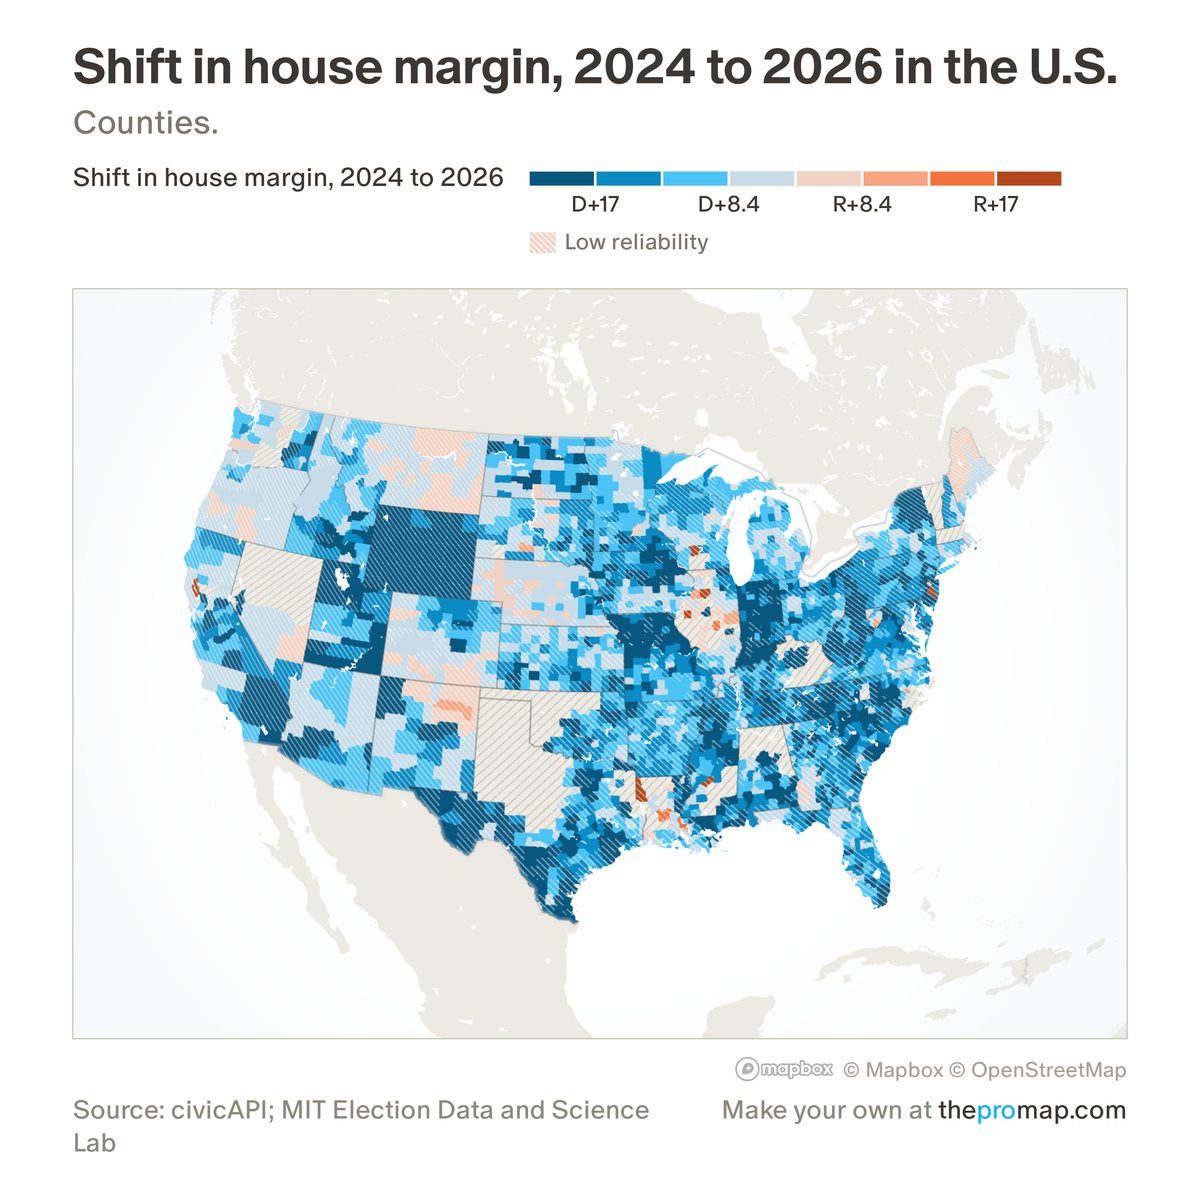
What this measure is
The 2026 House margin minus the 2024 House margin, both as a share of the two parties' votes and counting only districts with a Democrat and a Republican on the ballot: R+5 means the area moved 5 points toward Republicans, D+5 toward Democrats. District lines changed in several states between the two elections (Texas, California, North Carolina, Missouri, Ohio, Utah and others), so an area can compare different contests. The 2026 results are unofficial and still being counted. White stripes over the colour mark low reliability: under 95% of precincts reporting, or part of the area uncontested in either year.
Source, dates and coverage
- Source
- 2026: civicAPI (civicapi.org), unofficial; 2024: MIT Election Data and Science Lab precinct returns.
- Updated
- Refreshed while votes are being counted; the legend gives the time of the latest count. Latest data on the map: 2026.
- Areas on the map
- States, metro areas and counties.
- Group
- Politics
- Access
- ProMap Plus ($19 a month or $190 a year).
Values for every place
Shift in House margin, 2024 to 2026 is a ProMap Plus measure. The map shows it for the areas listed above. This page shows the map's national picture, the method and the source, and no figures.
ProMap Plus costs $19 a month or $190 a year. A free 7-day trial is offered on the map.
See shift in House margin, 2024 to 2026 in ProMap PlusHow to cite
Please also credit the original source: 2026: civicAPI (civicapi.org), unofficial; 2024: MIT Election Data and Science Lab precinct returns.