
Fall in the 2007–12 crash by ZIP code
An interactive U.S. map of fall in the 2007–12 crash for states, metro areas, counties and ZIP codes. Latest data: September 2026. PLUS
Open fall in the 2007–12 crash on the map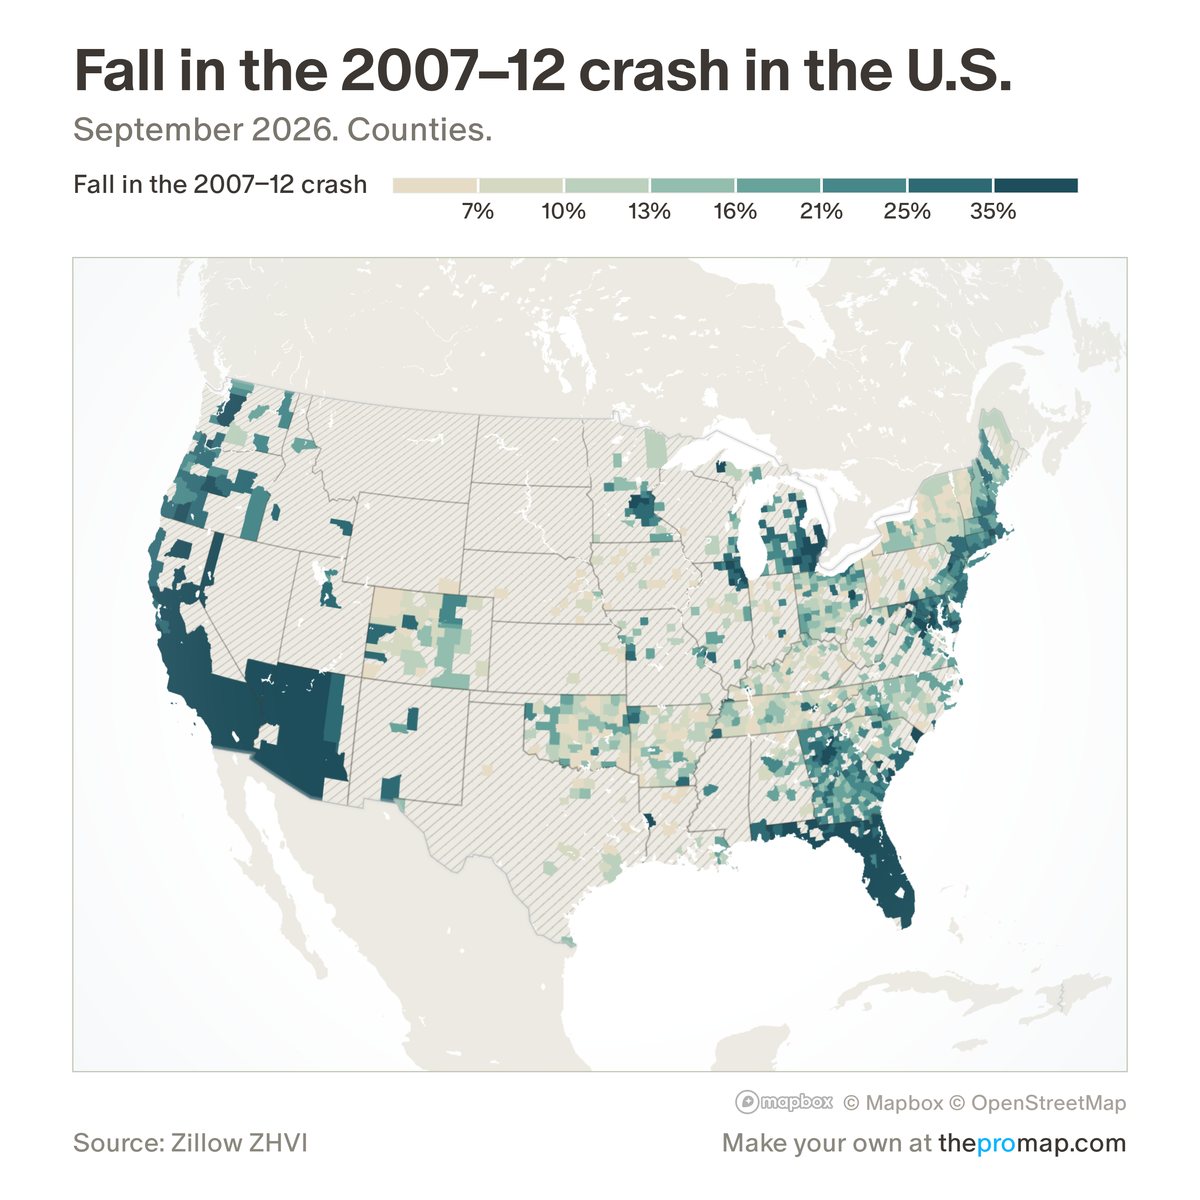
What this measure is
How far the typical home value fell around the 2007–12 housing crash, from its highest month in 2004–2009 to its lowest month after that, up to the end of 2014. 0% means no fall. Areas without Zillow values back to 2004 are hatched. Figures are not adjusted for inflation.
Source, dates and coverage
- Source
- Zillow Home Value Index, 2004–2014.
- Updated
- A fixed historical measure; it does not change with new data. Latest data on the map: September 2026.
- Areas on the map
- States, metro areas, counties and ZIP codes.
- Group
- Affordability & valuation
- Access
- ProMap Plus ($19 a month or $190 a year).
Values for every place
Fall in the 2007–12 crash is a ProMap Plus measure. The map shows it for the areas listed above. This page shows the map's national picture, the method and the source, and no figures.
ProMap Plus costs $19 a month or $190 a year. A free 7-day trial is offered on the map.
See fall in the 2007–12 crash in ProMap PlusHow to cite
Please also credit the original source: Zillow Home Value Index, 2004–2014.
More affordability & valuation measures
- Monthly cost to buy
- Cost to buy as % of income
- Income needed to buy
- Price-to-income ratio
- Price-to-income vs 2000–19
- Home value vs 2022 peak
- Zillow forecast: next 12 months
- Price-to-rent ratio
- Gross rental yield
- Owning minus renting (monthly)
- For-sale inventory vs 2017–19
- Homes sold vs 2017–19
- Owners with a mortgage