
Zillow forecast: next 12 months by ZIP code
An interactive U.S. map of Zillow forecast: next 12 months for metro areas and ZIP codes. Latest data: September 2026. PLUS
Open Zillow forecast: next 12 months on the map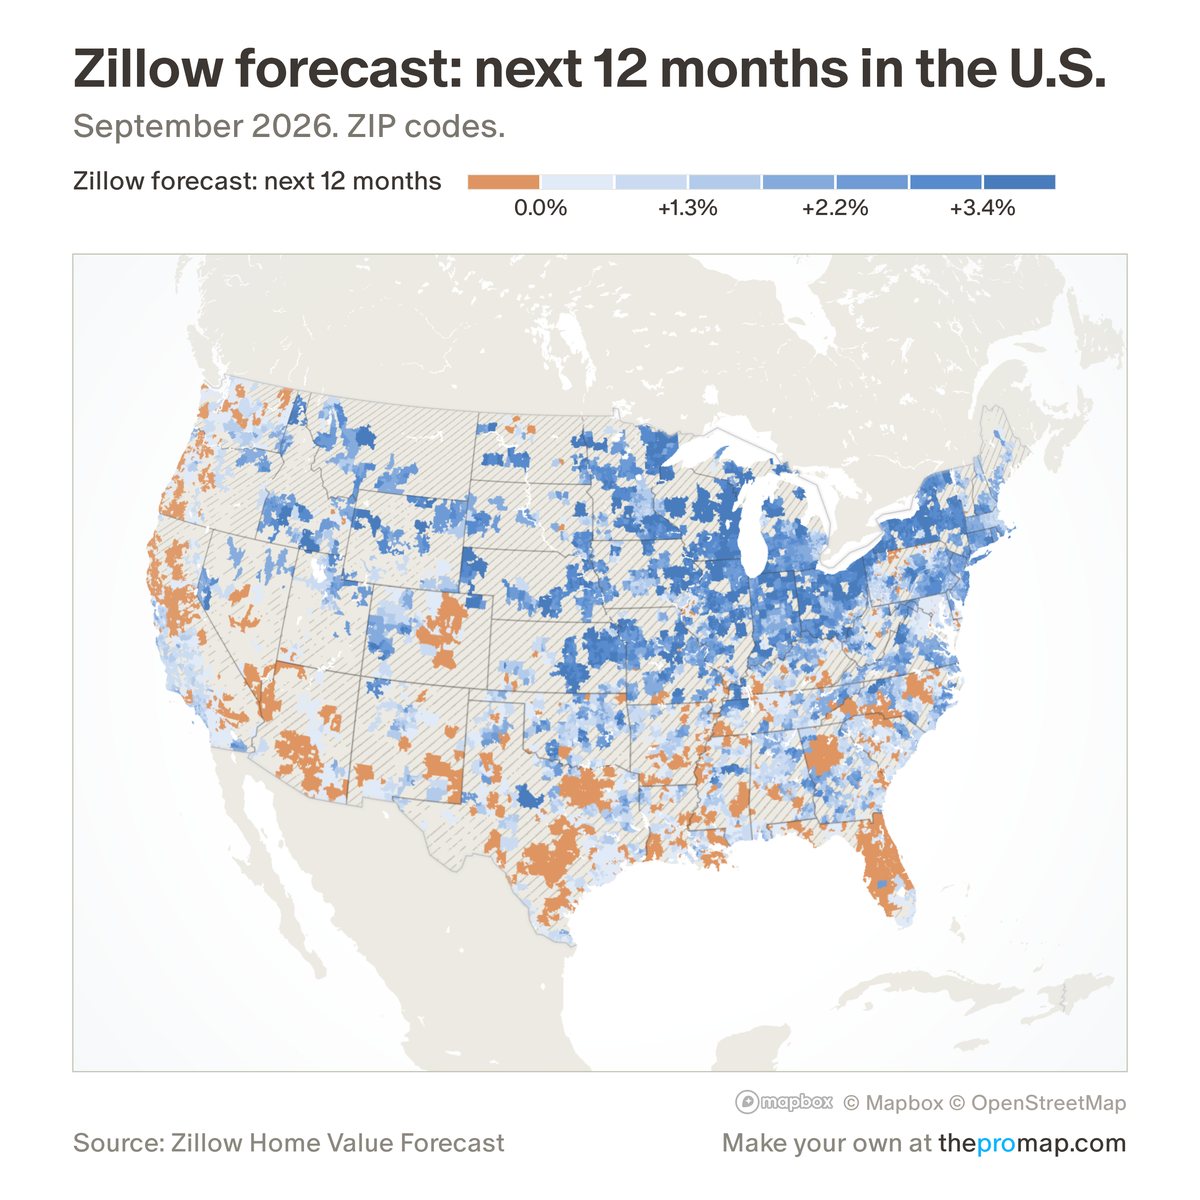
What this measure is
Zillow's own forecast of how much its typical home value will change over the next 12 months. It is a forecast, not data, and Zillow revises it each month. Zillow publishes it for metro areas and ZIP codes only.
Source, dates and coverage
- Source
- Zillow Home Value Forecast.
- Updated
- Monthly; the date is the month the forecast was made. Latest data on the map: September 2026.
- Areas on the map
- Metro areas and ZIP codes.
- Group
- Affordability & valuation
- Access
- ProMap Plus ($19 a month or $190 a year).
Values for every place
Zillow forecast: next 12 months is a ProMap Plus measure. The map shows it for the areas listed above. This page shows the map's national picture, the method and the source, and no figures.
ProMap Plus costs $19 a month or $190 a year. A free 7-day trial is offered on the map.
See Zillow forecast: next 12 months in ProMap PlusHow to cite
Home Economics (Aziz Sunderji), ProMap, “Zillow forecast: next 12 months”, https://homeeconomics.us/promap/measure/zillow-home-value-forecast, accessed 15 November 2026.
Please also credit the original source: Zillow Home Value Forecast.