
Monthly cost to buy by ZIP code
An interactive U.S. map of monthly cost to buy for states, metro areas, counties, ZIP codes and census tracts. Latest data: September 2026. PLUS
Open monthly cost to buy on the map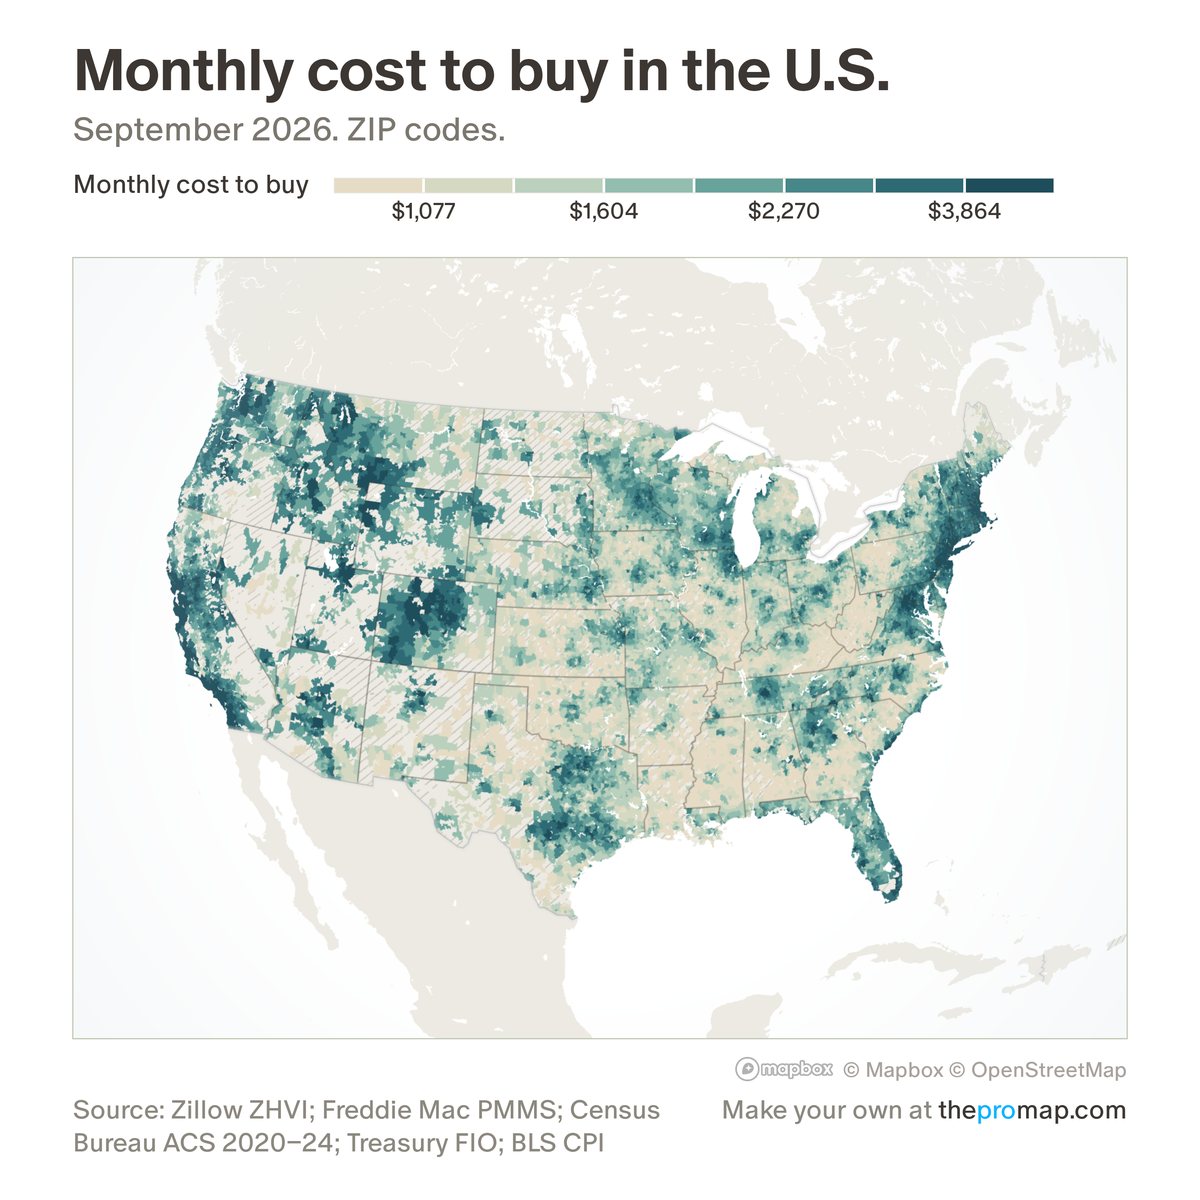
What this measure is
The monthly cost of buying the typical home today, an estimate. It assumes 20% down and a 30-year fixed mortgage at the month's average rate, plus the area's own property-tax rate and homeowners insurance. Insurance starts from the area's 2022 average premium and is moved forward with the national price index for homeowners insurance; mortgage insurance is not included.
Source, dates and coverage
- Source
- Zillow home values, Freddie Mac mortgage rates, Census Bureau American Community Survey, US Treasury Federal Insurance Office and Bureau of Labor Statistics data.
- Updated
- Monthly. Latest data on the map: September 2026.
- Areas on the map
- States, metro areas, counties, ZIP codes and census tracts.
- Group
- Affordability & valuation
- Access
- ProMap Plus ($19 a month or $190 a year).
Values for every place
Monthly cost to buy is a ProMap Plus measure. The map shows it for the areas listed above. This page shows the map's national picture, the method and the source, and no figures.
ProMap Plus costs $19 a month or $190 a year. A free 7-day trial is offered on the map.
See monthly cost to buy in ProMap PlusHow to cite
Please also credit the original source: Zillow home values, Freddie Mac mortgage rates, Census Bureau American Community Survey, US Treasury Federal Insurance Office and Bureau of Labor Statistics data.
More affordability & valuation measures
- Cost to buy as % of income
- Income needed to buy
- Price-to-income ratio
- Price-to-income vs 2000–19
- Home value vs 2022 peak
- Fall in the 2007–12 crash
- Zillow forecast: next 12 months
- Price-to-rent ratio
- Gross rental yield
- Owning minus renting (monthly)
- For-sale inventory vs 2017–19
- Homes sold vs 2017–19
- Owners with a mortgage