
Flood: expected yearly loss by ZIP code
An interactive U.S. map of flood: expected yearly loss for states, metro areas, counties, ZIP codes and census tracts. Latest data: 2025. PLUS
Open flood: expected yearly loss on the map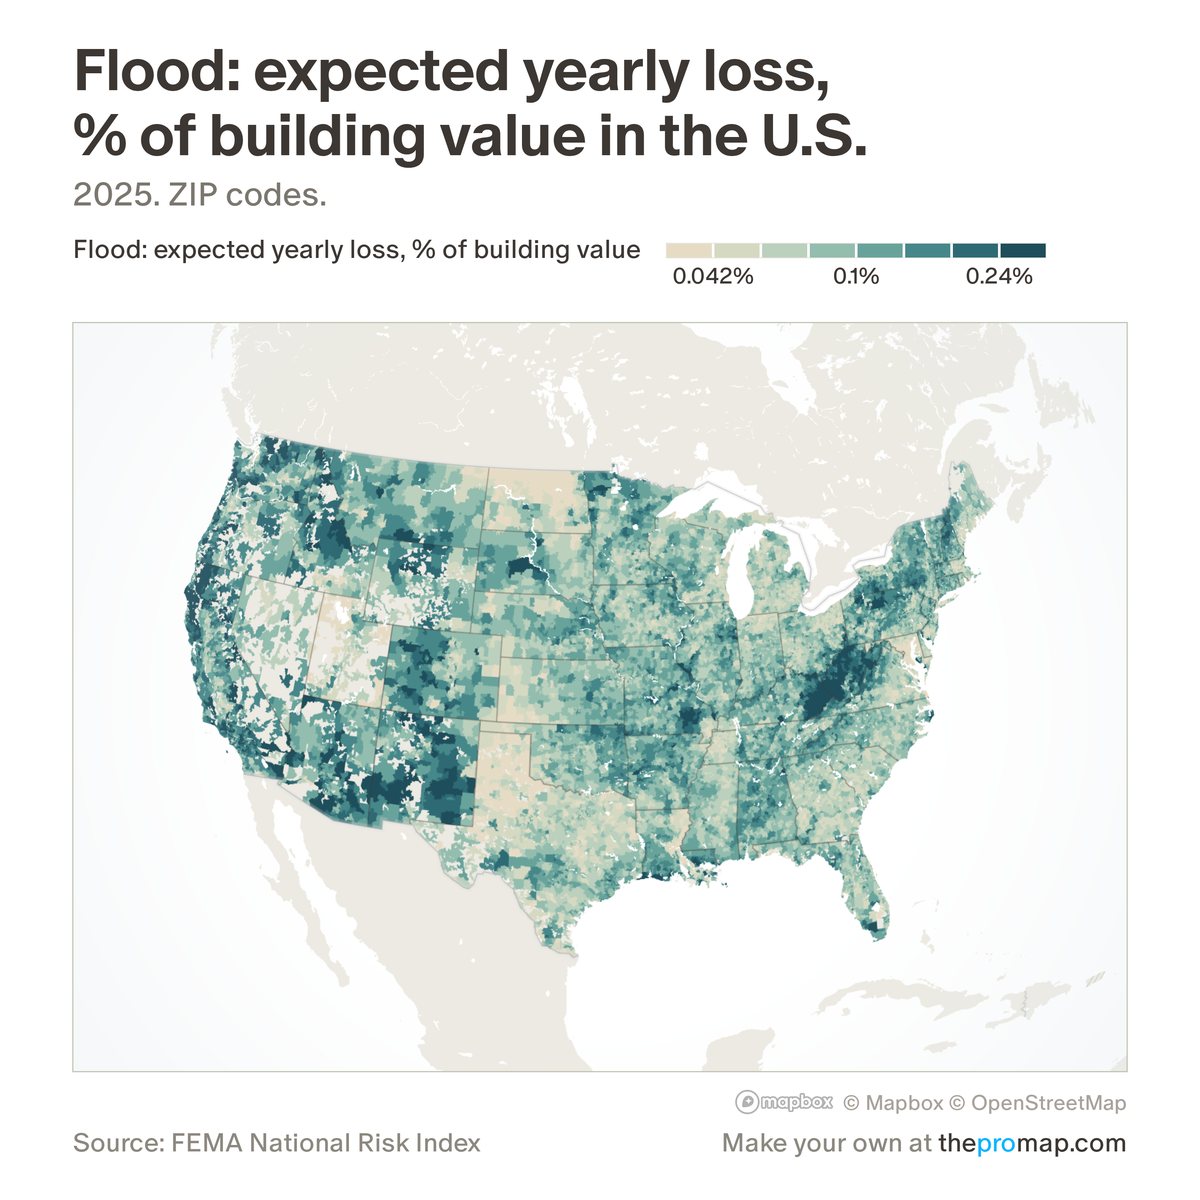
What this measure is
FEMA's estimate of the average yearly damage to buildings from river, rain and coastal flooding, shown as a share of the value of all buildings or, with the $ switch, in dollars a year for the whole area. Expected loss is FEMA's long-run yearly average, built from each hazard's history, the buildings exposed and how badly they are damaged; building value is FEMA's estimate of the cost to replace the buildings, not their market price. FEMA estimates river flooding partly from regional averages, so values can jump at state lines; Floodplain share compares places more evenly. It is a modelled average, not an insurance premium or a forecast for one home.
Source, dates and coverage
- Source
- FEMA National Risk Index; ZIP codes, metros and states added up by Home Economics.
- Updated
- When FEMA releases a new version of the index. Latest data on the map: 2025.
- Areas on the map
- States, metro areas, counties, ZIP codes and census tracts.
- Group
- Climate & hazard risk
- Access
- ProMap Plus ($19 a month or $190 a year).
Values for every place
Flood: expected yearly loss is a ProMap Plus measure. The map shows it for the areas listed above. This page shows the map's national picture, the method and the source, and no figures.
ProMap Plus costs $19 a month or $190 a year. A free 7-day trial is offered on the map.
See flood: expected yearly loss in ProMap PlusHow to cite
Please also credit the original source: FEMA National Risk Index; ZIP codes, metros and states added up by Home Economics.