
Hurricane: expected yearly loss by ZIP code
An interactive U.S. map of hurricane: expected yearly loss for states, metro areas, counties, ZIP codes and census tracts. Latest data: 2025. PLUS
Open hurricane: expected yearly loss on the map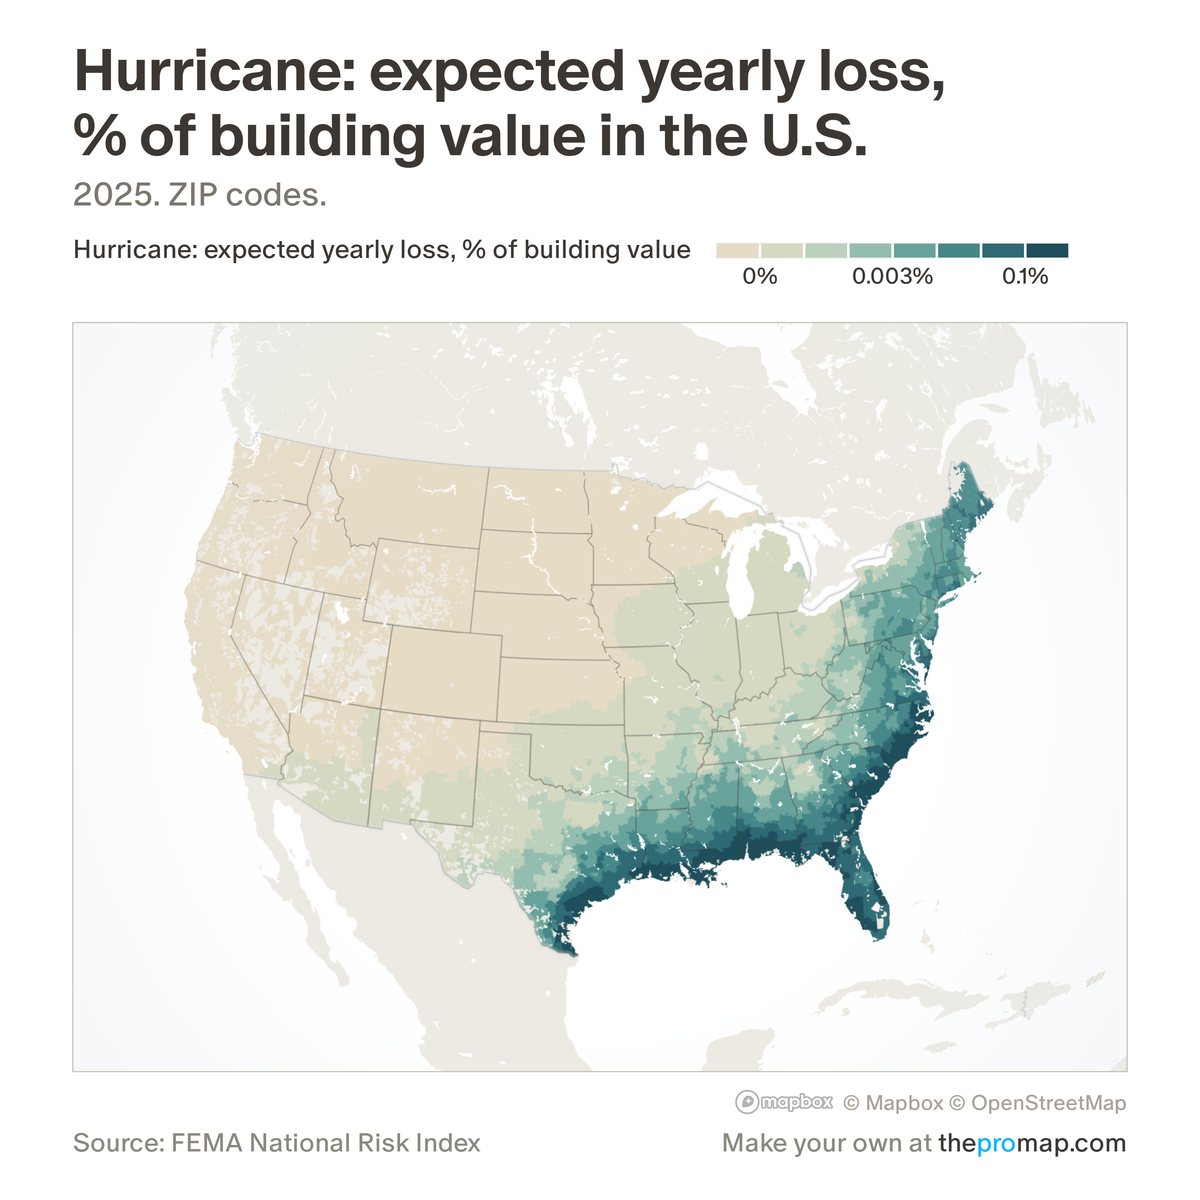
What this measure is
FEMA's estimate of the average yearly damage to buildings from hurricane winds, shown as a share of the value of all buildings or, with the $ switch, in dollars a year for the whole area. Expected loss is FEMA's long-run yearly average, built from each hazard's history, the buildings exposed and how badly they are damaged; building value is FEMA's estimate of the cost to replace the buildings, not their market price. It is a modelled average, not an insurance premium or a forecast for one home.
Source, dates and coverage
- Source
- FEMA National Risk Index; ZIP codes, metros and states added up by Home Economics.
- Updated
- When FEMA releases a new version of the index. Latest data on the map: 2025.
- Areas on the map
- States, metro areas, counties, ZIP codes and census tracts.
- Group
- Climate & hazard risk
- Access
- ProMap Plus ($19 a month or $190 a year).
Values for every place
Hurricane: expected yearly loss is a ProMap Plus measure. The map shows it for the areas listed above. This page shows the map's national picture, the method and the source, and no figures.
ProMap Plus costs $19 a month or $190 a year. A free 7-day trial is offered on the map.
See hurricane: expected yearly loss in ProMap PlusHow to cite
Please also credit the original source: FEMA National Risk Index; ZIP codes, metros and states added up by Home Economics.