
Hot days (95°F+) a year by ZIP code
An interactive U.S. map of hot days (95°F+) a year for states, metro areas, counties, ZIP codes and census tracts. Latest data: 2015–2024. PLUS
Open hot days (95°F+) a year on the map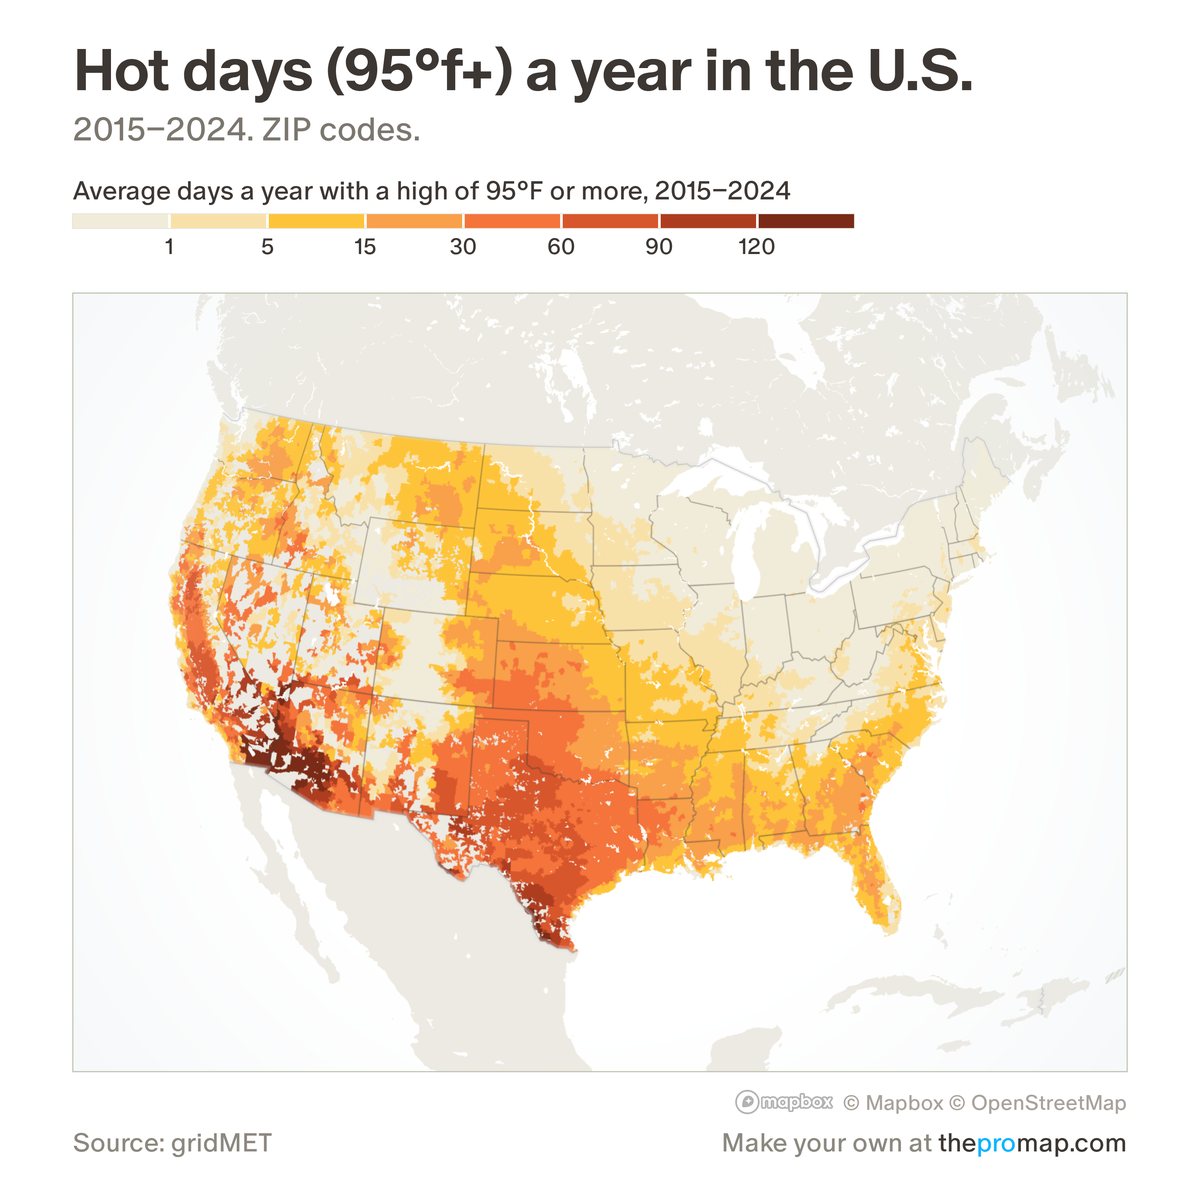
What this measure is
The average number of days a year with a high of 95°F or more, over 2015–2024. Each place is the average of the 4-kilometre grid cells where its residents live, so it describes the heat people experience rather than the hottest corner of the area. It does not account for humidity. Hatched areas have no figure: the source covers only the lower 48 states, not Alaska or Hawaii.
Source, dates and coverage
- Source
- gridMET daily temperatures (Climatology Lab, University of Idaho); weighted by where people live, Home Economics.
- Updated
- A fixed 10-year average, 2015–2024. Latest data on the map: 2015–2024.
- Areas on the map
- States, metro areas, counties, ZIP codes and census tracts.
- Group
- Climate & hazard risk
- Access
- ProMap Plus ($19 a month or $190 a year).
Values for every place
Hot days (95°F+) a year is a ProMap Plus measure. The map shows it for the areas listed above. This page shows the map's national picture, the method and the source, and no figures.
ProMap Plus costs $19 a month or $190 a year. A free 7-day trial is offered on the map.
See hot days (95°F+) a year in ProMap PlusHow to cite
Please also credit the original source: gridMET daily temperatures (Climatology Lab, University of Idaho); weighted by where people live, Home Economics.