
January temperature by ZIP code
An interactive U.S. map of January temperature for states, metro areas, counties and ZIP codes. Latest data: 1991–2020. PLUS
Open January temperature on the map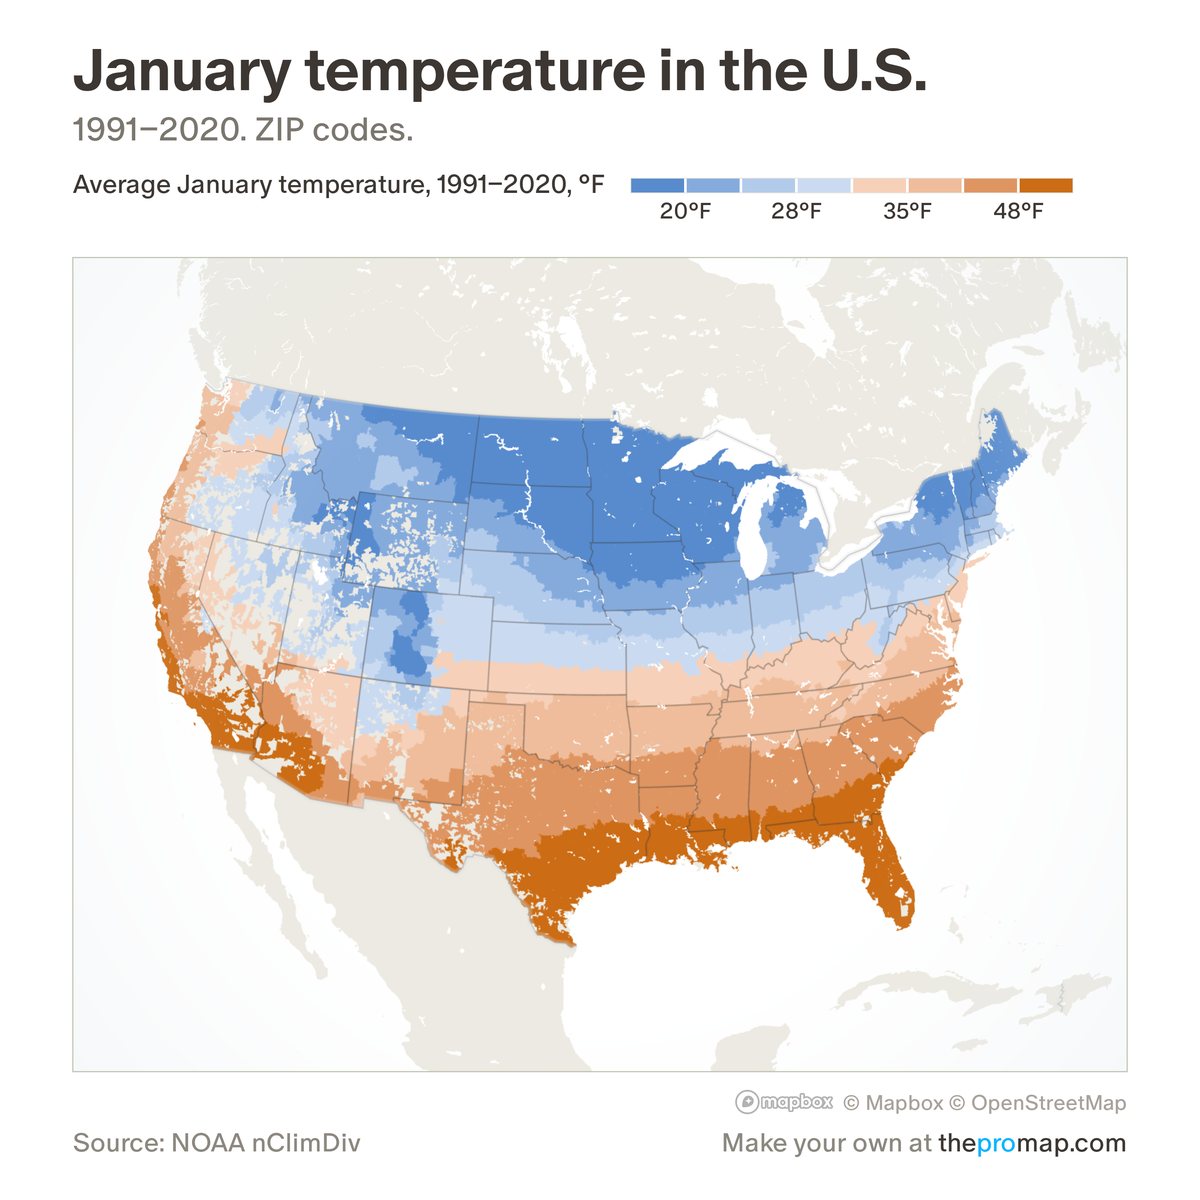
What this measure is
The average January temperature over 1991–2020, in degrees Fahrenheit, day and night together. It comes from NOAA's county series, which averages a 5-kilometre grid built from weather stations, so a county with mountains or a coast reads as its overall average, not as its main town. States, metros and ZIP codes are population-weighted averages of their counties.
Source, dates and coverage
- Source
- National Oceanic and Atmospheric Administration (NOAA), county climate series; averages by Home Economics.
- Updated
- A fixed 30-year average, 1991–2020. Latest data on the map: 1991–2020.
- Areas on the map
- States, metro areas, counties and ZIP codes.
- Group
- Climate & hazard risk
- Access
- ProMap Plus ($19 a month or $190 a year).
Values for every place
January temperature is a ProMap Plus measure. The map shows it for the areas listed above. This page shows the map's national picture, the method and the source, and no figures.
ProMap Plus costs $19 a month or $190 a year. A free 7-day trial is offered on the map.
See January temperature in ProMap PlusHow to cite
Please also credit the original source: National Oceanic and Atmospheric Administration (NOAA), county climate series; averages by Home Economics.